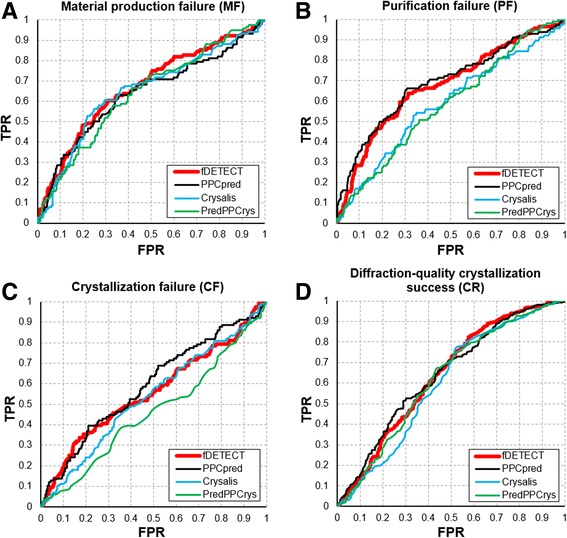
Fig. 3.

ROC curves for the four predictors of the four steps of the crystallization pipeline: failure of material production (panel a), failure to purify (panel b), failure to crystallize (panel c) and success to yield diffraction-quality crystals (panel d). The curves were computed on the TESTsmall dataset
