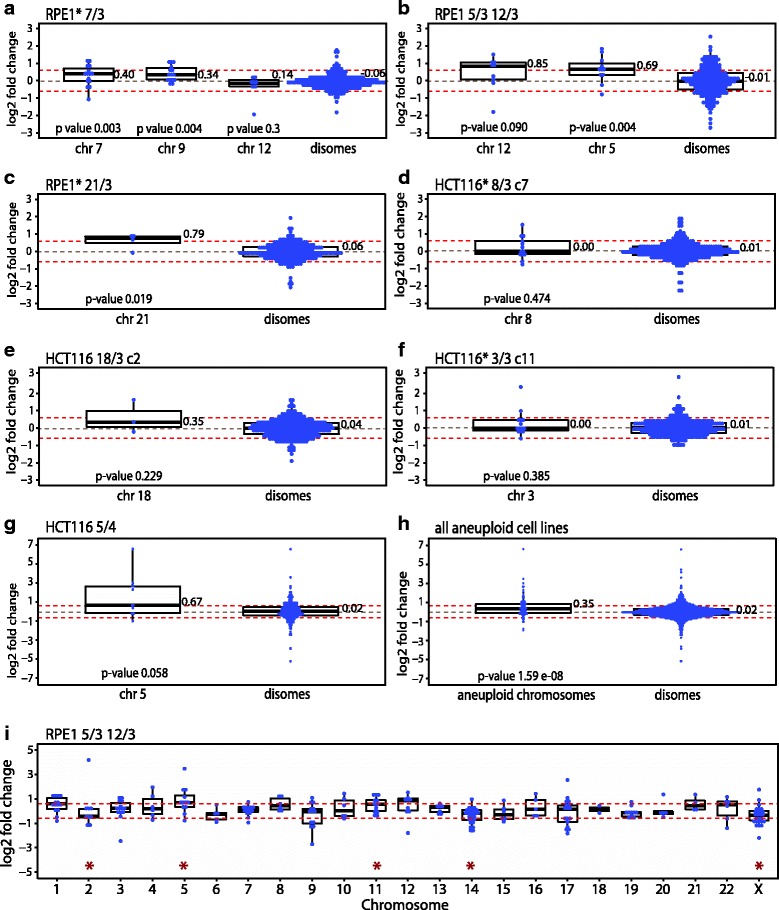
Fig. 2.

Expression of microRNAs encoded on the aneuploid chromosomes compared to expression of microRNAs encoded on disomic chromosomes. Comparison of the expression changes of miRNAs from the aneuploid chromosome and for the miRNAs of the remaining disomic chromosomes in individual cell lines. a RPE1* 7/3 (note that this cell line spontaneously gained additional copy of chromosome 9 and 12). b RPE1* 21/3, c RPE1 5/3 12/3, d HCT116 5/4, e HCT116 18/3 clone 2, f HCT116* 3/3 clone 11, g HCT116* 8/3 clone 7, and h Expression fold changes of miRNAs of all aneuploid chromosomes from all analysed cell lines compared to all disomic miRNAs from all cell lines. i Representative blot of the expression changes of miRNAs on each individual chromosome for RPE1 12/3 5/3. Blots for the remaining cell lines are in in Additional file 1: Figure S2. For all blots: Each blue dot represents a microRNA, the log2 fold change expression is always normalized to the expression levels of the corresponding parental cell line. Boxplot present 75%, 50% and 25% quantile; the median values are shown. Red dotted lines marked log2 of 2-fold change (0.67). Significance was tested with Mann-Whitney-Wilcoxon test (marked with red asterisk in panel i). Cell lines with * contain H2B-GFP
