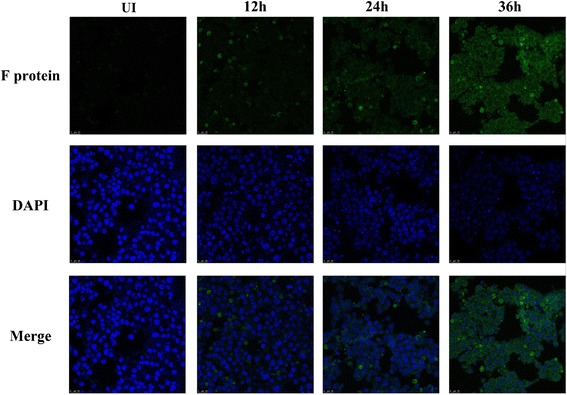
Fig. 3.

F protein expression levels in RSV-infected and uninfected N2a cells. RSV-infected and uninfected N2a cells were stained by an anti-F protein antibody at 12 h pi, 24 h pi, and 36 h pi and viewed under a fluorescence microscope; UI indicates the uninfected control. Nuclei were stained with DAPI and shown as blue fluorescence, and the RSV F protein was stained with a fluorescence-labeled antibody and shown as green fluorescence. The length of the infection was correlated with increasing RSV F protein expression (magnification, 400×)
