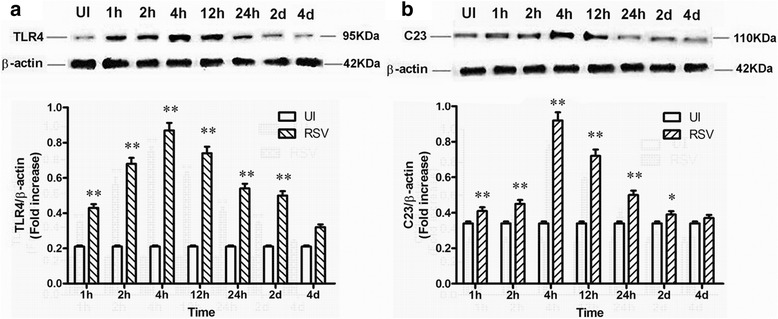
Fig. 7.

TLR4 and nucleolin protein expression in RSV-infected and uninfected N2a cells was measured by Western blot analysis. UI indicates the uninfected control; lanes 2–8 represent N2a cells at 1 h pi, 2 h pi, 4 h pi, 12 h pi, 24 h pi, 2 d pi, and 4 d pi, respectively. TLR4 (a) and nucleolin (b) protein expression levels were enhanced by infection durations less than 4 h pi and suppressed by infection durations greater than 4 h pi. The relative fold changes and statistical analyses of TLR4 (a) and nucleolin (b) expression levels were evaluated using GraphPad Prism 5 software (GraphPad Software Inc., La Jolla, CA, USA). Data are expressed as the mean ± SEM, and three independent experiments were run. *P < 0.05 was considered statistically significant, and **P < 0.01 was considered highly statistically significant compared with the uninfected control
