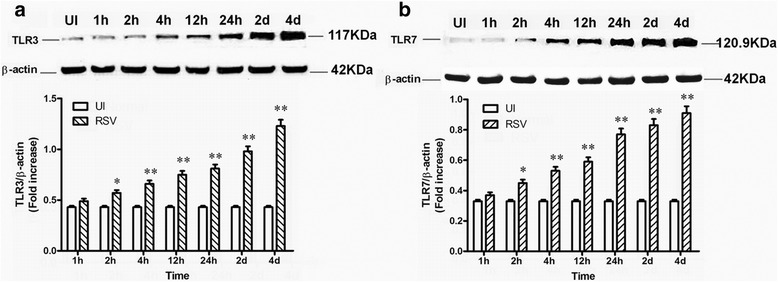
Fig. 9.

TLR3 and TLR7 protein expression in RSV-infected and uninfected N2a cells at different time points as determined by Western blot analysis. Lane 1: mock control; lanes 2–8: RSV-infected N2a cells at the time points 1 h pi, 2 h pi, 4 h pi, 12 h pi, 24 h pi, 2 d pi, and 4 d pi, respectively. The protein levels of TLR3 (a) and TLR7 (b) were enhanced as the duration of RSV infection was extended. In addition, the statistical significance of relative fold changes in TLR3 (a) and TLR7 (b) expression were evaluated using GraphPad Prism 5 software (GraphPad Software Inc.). Data are expressed as the mean ± SEM, and three independent experiments were run. *P < 0.05, was considered statistically significant, and **P < 0.01 was considered highly statistically significant compared with the uninfected control
