Fig. 1.

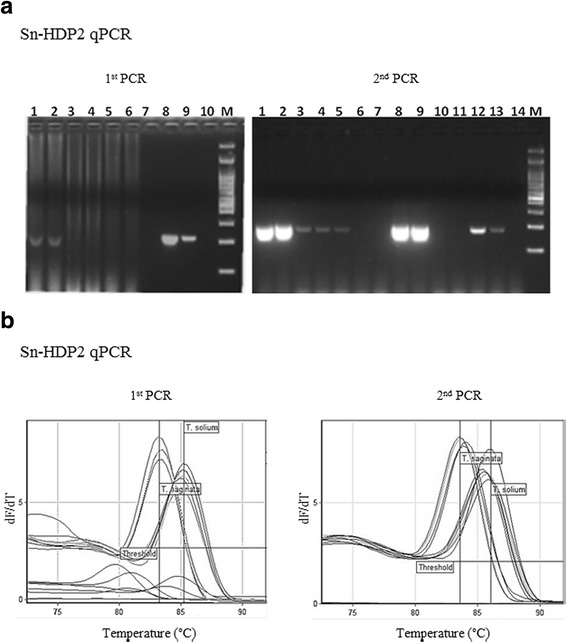
Diagnosis of human taeniosis using Sn-HDP2 cPCR and Sn-HDP2 qPCR. a Sn-HDP2 cPCR applied to 3× fecal samples from a patient with taeniasis. Amplification products fractionated on 2% agarose gels and stained by GelRed. First PCR: Lanes 1, 2: fecal sample 1 (positive by microscopy); Lanes 3, 4: fecal sample 2; Lanes 5, 6: fecal sample 3 (negative by microscopy); Lane 8: T. saginata DNA (positive control); Lane 9: T. solium DNA (positive control); Lane 10: no DNA (negative control); Lane M: 100 bp DNA Ladder (NIPPON Genetics Europe, Dueren, Germany). Second PCR: Lanes 1, 2: fecal sample 1; Lanes 3, 4: fecal sample 2; Lanes 5, 6: fecal sample 3; Lanes 8, 9: T. saginata DNA (positive control); Lanes 12, 13: T. solium DNA (positive control); Lane 14: no DNA (negative control); Lane M: 100 bp DNA Ladder (Genetics). Sn-HDP2 cPCR amplification products were sequenced. b Melting curves corresponding to the new Sn-HDP2 qPCR (both first and second PCR runs), applied to both T. saginata and T. solium DNA
