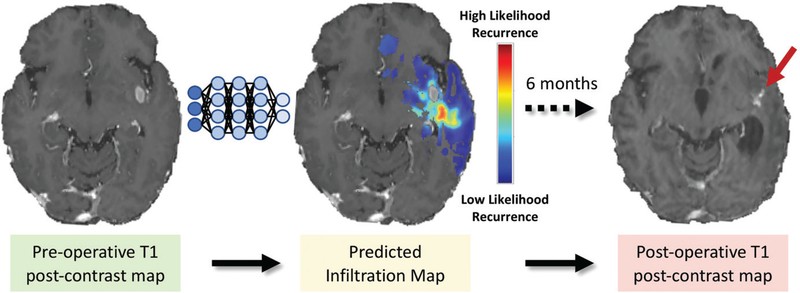
Figure 5:
Predictive maps of tumor infiltration. Multimodal pre-operative conventional and advanced MRI data were analyzed with support vector machines to generate an estimated infiltration map overlaid on postcontrast T1-weighted image (red areas signify higher risk). Postcontrast T1-weighted MR image obtained at 6-month follow-up (right) demonstrates area of recurrence near site of highest predicted infiltration (arrow).

