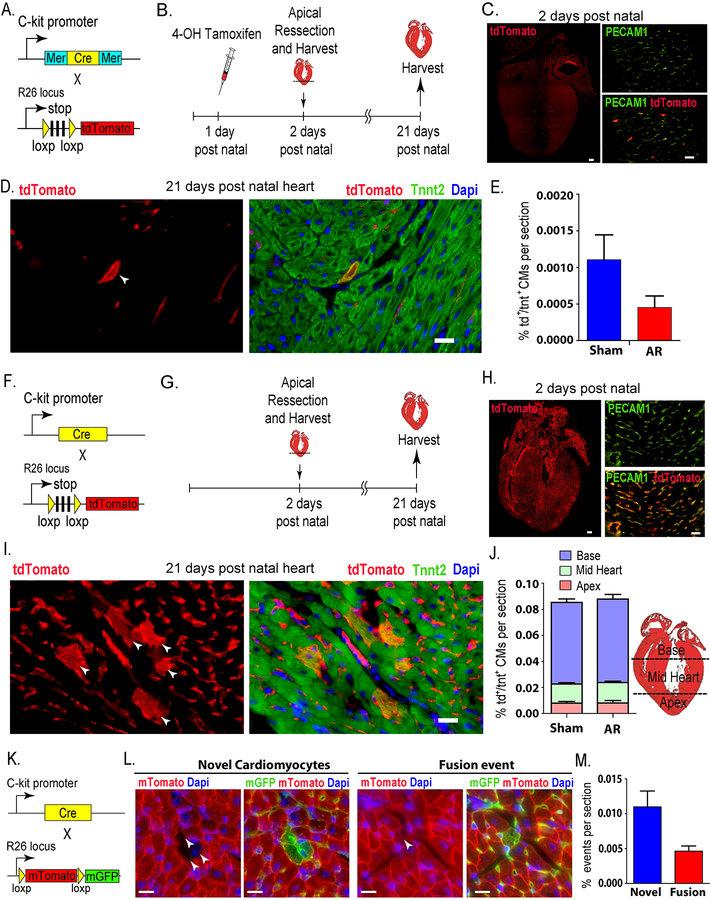
Figure 1: Role of C-kit cells in cardiomyogenesis in the neonatal mouse heart.
(A) Schematic representing genetic mouse model of tamoxifen-dependent irreversible labeling of C-kit cells with tdTomato. (B) Time course of fate-mapping experiment. (C) Left panel: P2 whole heart showing ~ 300 tdTomato+ cell/section. Scale bar, 100μm (n=3). Right panel: more than 90% colocalization of tdTomato+ cells with PECAM1 staining. Scale bar, 20μm (D) Left panel: p21 heart (white arrowhead) showing a single tdTomato+ cardiomyocyte, right panel: showing the same cell to be tdTomato+/Tnnt2+. Scale bar, 20μm. (E) Graph showing no statistically significant difference in the percentage of be tdTomato+/Tnnt2+ CMs between sham and resected hearts (Sham: n=5 / AR: n=3). (F) Schematic representing genetic mouse model of continuous labelling of C-kit cells with tdTomato. (G) Time course of fate-mapping experiment. (H) Left panel: P2 whole heart scan showing widespread tdTomato+ signal. Scale bar, 100μm (n=10). Right panel: more than 90% colocalization of tdTomato with PECAM1 staining. Scale bar, 20μm. (I) Left panel: p21 heart showing several arrowheads pointing to several tdTomato+ cardiomyocyte in colony, right panel: showing same cells to be tdTomato+/Tnnt2+. Scale bar, 20μm. (J) Graph showing no statistically significant difference in the percentage of tdTomato+/Tnnt2+ CMs between sham and resected hearts, also differential percentage of the location of the cells in heart compartments (Sham: n=10 /AR: n=10). (K) Schematic representing the genetic cross of constitutive C-kitcre/+ with the reporter mTmG mice to enable detection of fusion events (n=10). (L) Left panels: p21 heart showing novel cardiomyocytes (tdTomato−/GFP+). Right panels: p21 heart showing fusion-derived cardiomyocytes (tdTomato−/GFP+). Scale bars, 20μm. (M) Graph showing percentage of real (novel cardiomyocytes) and fusion events.

