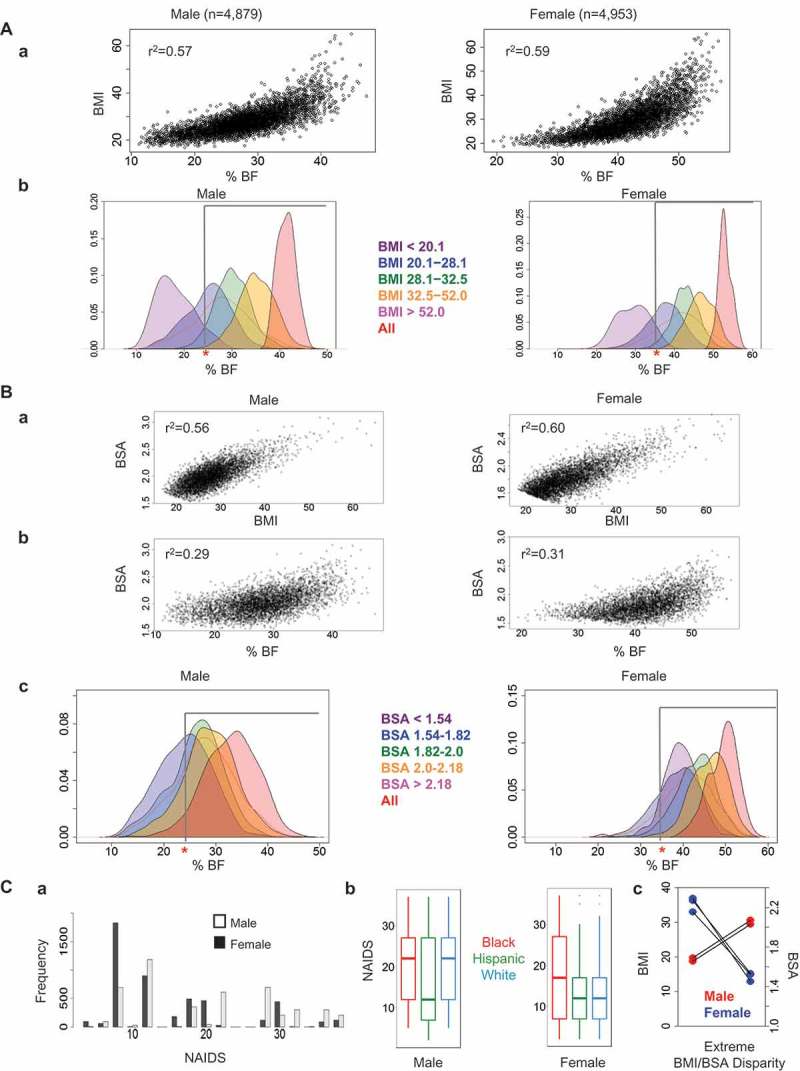
Figure 1.

Relationship of %BF with BMI and BSA. A. Distribution of %BF by BMI range. (a) DXA-measured percentage of body fat (%BF) compared with BMI in non-diabetic adults; male adults (n = 4,879) and female adults (n = 4,953). (b) Distribution of %BF plotted according to BMI ranges. The population was classified into five BMI groups used in NAIDS; BMI<20.1 (purple), BMI:20.1–28.1 (blue), BMI:28.1–32.5 (green), BMI:32.5–52.0 (yellow), and BMI>52.0 (red). The red line depicts the proportion of individuals with a given %BF for all subjects. The cutoff for obesity as determined by %BF is shown by the gray bar (25% for males and 35% for females). (B) Distribution of %BF by BSA range. (a) Correlation between BMI and BSA. (b) DXA-measured %BF compared with BSA in male and female adults. c. Distribution of %BF by sex plotted according to BSA ranges. The population was classified into five BSA groups used in NAIDS; BSA<1.54 (purple), BSA:1.54–1.82 (blue), BSA:1.82–2 (green), BSA:2–2.18 (orange), and BSA>2.18 (red). (C) Comparison of NAIDS, BMI, and BSA by sex. a. Distribution of NAIDS for male and female subjects from NHANES data set. (b) Distribution of NAIDS across sex and race/ethnicity groups from NHANES data set. The center bar indicates the median of each group, the box contains the 25th-75th percentile of data, and the whiskers show the range of all data. (c) Cases of extreme BMI/BSA disparity in males and females from NHANES data set.
