. 2019 Feb 12;8:e40811. doi: 10.7554/eLife.40811

Figure 6. Altered RNA processing function in mice overexpression FUS.

(A) Principal Component Analysis (PCA) of differentially expressed genes in spinal cords from 30-day-old non-transgenic, hemizygous and homozygous FUSWT mice. PCA of count data across all three conditions shows a clear separation of homozygous FUS mice separately from both non-transgenic and hemizygous FUS mice across the first two principal components. (B) Hierarchical clustering of gene-centered count data cleanly categorizes the data, clustering homozygous FUS mice separately from both non-transgenic and hemizygous FUS mice. (C–H) qRT-PCR validation of selective genes identified by RNA-seq: most up-regulated genes (C), most down-regulated genes (D), genes involved in lysosome function (E), genes involved in MAPK kinase pathway (F), genes with exceptional long introns (G), motor neurons genes (H). The data represent the average of at least three animals per genotype ±SEM. The changes are specific to doubly transgenics and transgene homozygotes, but not other genotypes.

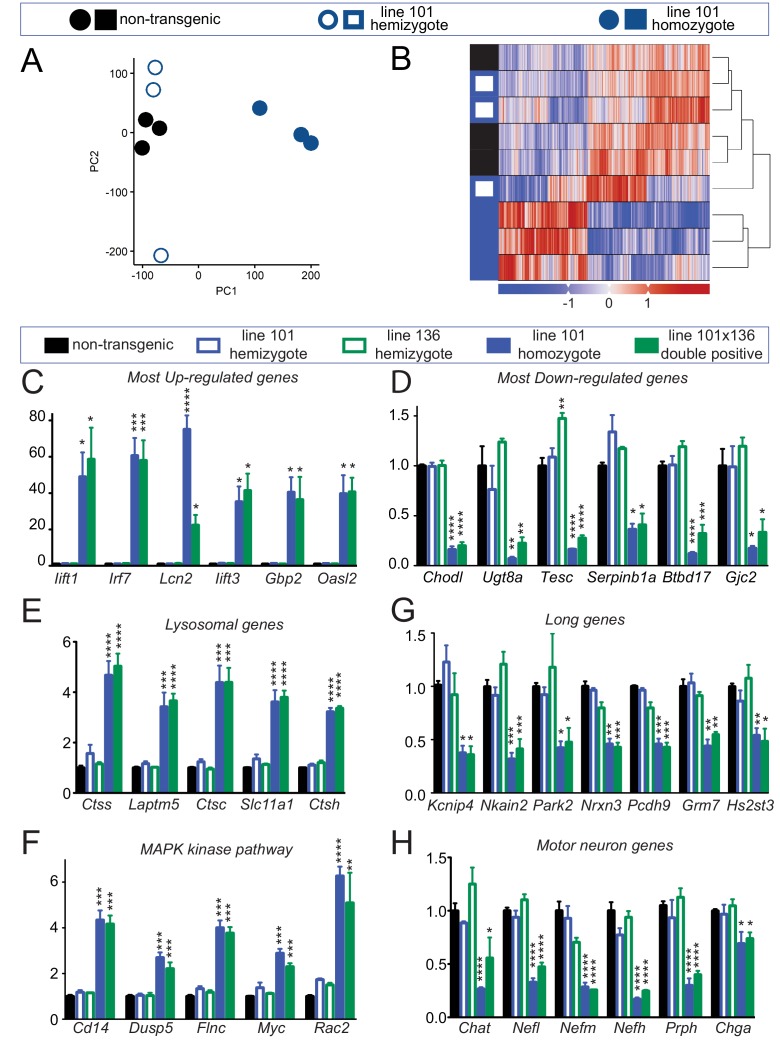
Figure 6—source data 1. qRT-PCR validation for differentially expressed genes (DEGs).
DOI: 10.7554/eLife.40811.021

Figure 6.

Figure 6—figure supplement 1. Distinct expression profiles in mice overexpression FUS.

Figure 6—figure supplement 1.

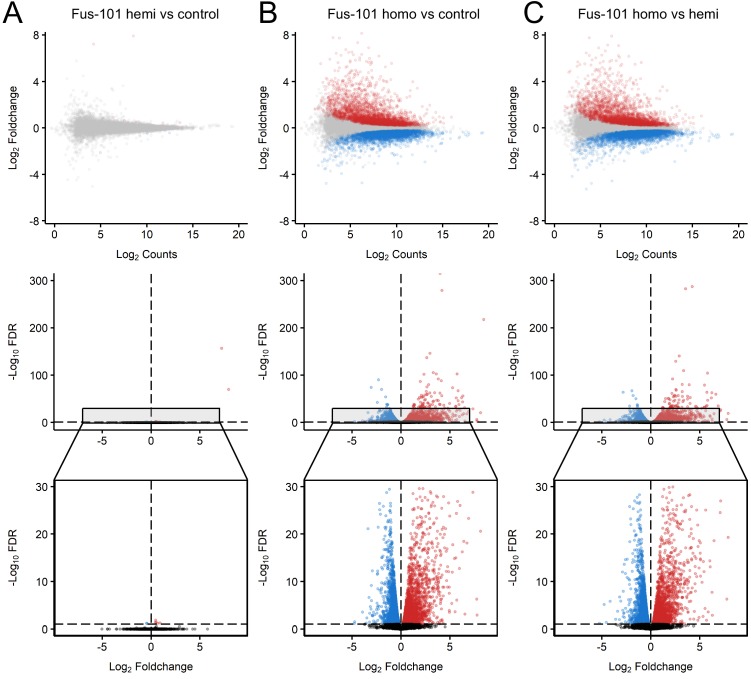
MA and volcano plots of pairwise contrasts of non-transgenic, hemizygous FUS and homozygous FUSWT mice transcriptomes reveal patterns of differential expression (FDR < 0.1, effect size > √ 2, Red: upregulated; Blue: downregulated) between homozygous FUS and non-transgenic/hemizygous FUS conditions. (B, C), but not between non-transgenic and heterozygous FUS conditions (A). in MA plots, x and y-axis indicate Log-scaled Sleuth normalized observed counts and Log2 foldchange respectively. In volcano plots x and y-axis indicate -Log10 FDR and -Log2 Foldchange respectively.
Figure 6—figure supplement 2. Gene ontology enrichment (Biological process) of differentially expressed genes in FUS overexpressing mice.

Figure 6—figure supplement 2.

Red and blue bars represent up and down-regulated genes respectively and the X-axis represents the log-scaled FDR-corrected p-value. Up-regulated genes were enriched for immune-related terms such as defense response, innate immune response and regulation of immune system process. Down-regulated genes were enriched in metabolism-related terms such as steroid biosynthesis process, cellular nitrogen compound metabolic process and cholesterol biosynthetic process.
Figure 6—figure supplement 3. No apparent gene expression changes in pre-symptomatic FUS over-expressing mice.

Figure 6—figure supplement 3.

(A–F) qRT-PCR validation of selective genes identified by RNA-seq in 14 day old spinal cord mice: most up-regulated genes (A), most down-regulated genes (B), genes involved in lysosome function (C), genes involved in MAPK kinase pathway (D), genes with exceptional long introns (E), motor neurons genes (F). The data represent the average of at least three animals per genotype ±SEM.