Fig. 3.
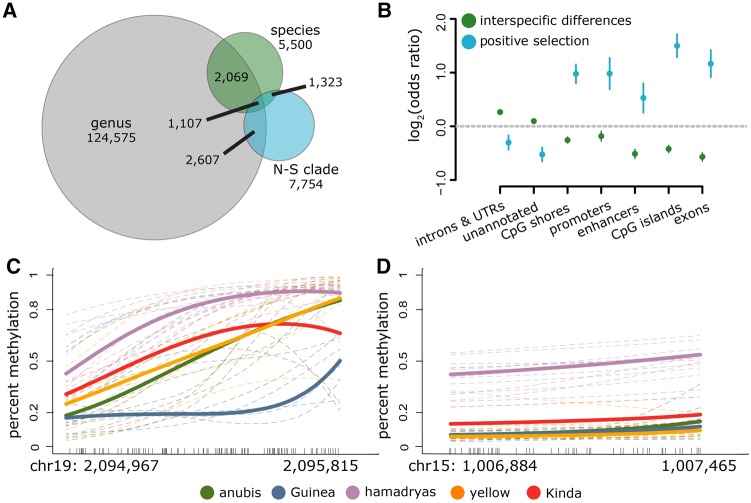
Interspecific differences in DNA methylation levels. (A) The number of CpG sites that exhibit significant taxonomic structure at successive levels of the phylogeny. Sites significantly overlap between genus and N–S clade (log2(OR) = 0.990, P = 2.82 × 10−240), genus and species (log2(OR) = 1.176, P = 2.760 × 10−276), and N–S clade and species (log2(OR) = 5.580, P < 100 × 10−300). (B) Enrichment by genomic context for 1) CpG sites in which DNA methylation levels show significant taxonomic structure by clade or species (green dots; background set is the full set of n = 756,262 CpG sites analyzed), and 2) CpG sites in which OU models and heuristic analyses (for clade-specific shifts) or heuristic analyses (for species-specific shifts) indicate a likely history of positive selection (blue dots; background set is n = 20,360 taxonomically structured CpG sites). Functional elements that are depleted for significant taxonomic structure overall are nevertheless enriched for a signature of selection among those sites that do exhibit taxonomic structure. (C, D) Examples of large DMRs. Dashes along the x-axis show the location of each measured CpG site in the region and lines show the smoothed mean DNA methylation level (BSmooth: Hansen et al. 2012). Thin dashed lines represent individual samples, and bold lines represent mean methylation levels per species. A Guinea baboon-specific DMR associated with the Leucine Rich Repeat and Ig Domain Containing 3 (LINGO3) gene is shown in (C) and a hamadryas baboon-specific DMR associated with the taperin (TPRN) and transmembrane protein 203 (TMEM203) genes is shown in (D).

