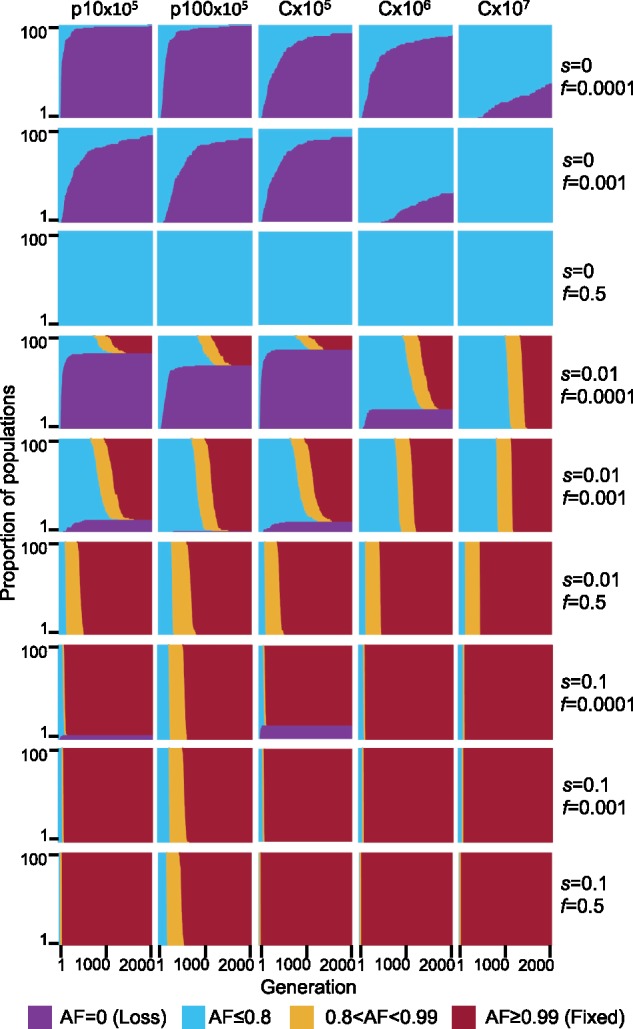
Fig. 3.

Simulated evolutionary dynamics of mutant alleles on plasmids and chromosomes. AF dynamics over 2,000 generations in 100 replicate simulated populations. Columns are the five combinations of simulated replicon type and population size, and rows are the different combinations of selective coefficient (s) and initial AF (f). Generations are on the x-axis, proportion of AF of replicates are stacked along the y-axis, population AF is color coded. For f = 0.001 and f = 0.0001, the starting frequency of mutant alleles is randomly sampled with the respective frequencies. For f = 0.5, the starting frequency of the mutant allele is exactly 0.5 for the chromosome and exactly 0.5 inside each cell for the plasmids. Note that, the initial frequency of cells with a mutant allele in the population is higher in the plasmid simulations compared with chromosome simulations (see supplementary table S4, Supplementary Material online, for expected number of mutant cells).
