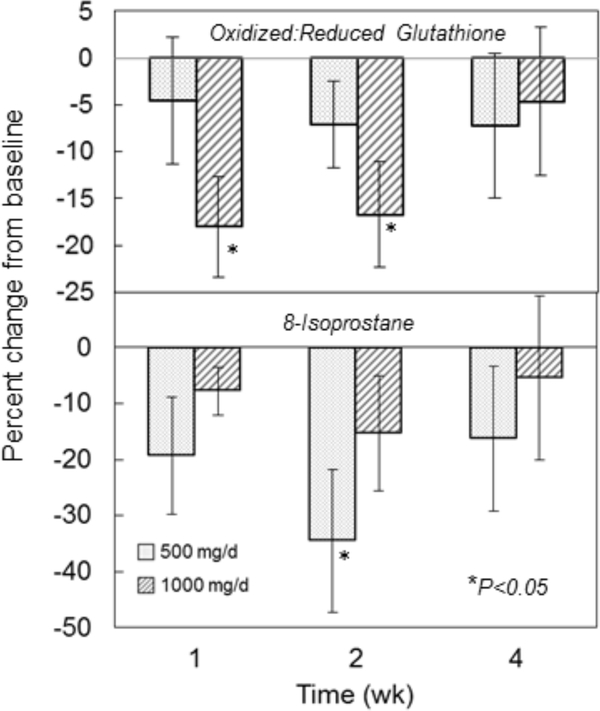
Figure 4:
Effect of liposomal glutathione supplementation on blood biomarkers of oxidative stress. Subjects were randomized to 500 or 1000 mg/d liposomal GSH for 4 weeks. Blood was collected at baseline and after 1, 2 and 4 weeks. Top panel: GSH and its major oxidized forms GSSG and GSSP were determined in whole blood as described in text. Baseline ratios ranged from 0.24 to 0.42 (mean±SE: 0.31±0.02) for all subjects [low dose group: 0.24 to 0.34 (mean±SE: 0.30±0.02); high dose group: 0.25 to 0.42 (mean±SE: 0.32±0.02)]. Bottom panel: plasma 8-isoprostane levels were measured by ELISA as described in text. Results are expressed as % changes in pg/ml from baseline. Baseline values ranged from 63.1 to 1170 pg/ml (mean±SE: 214±90.6) for all subjects [low dose group: 78.6 to 1170 (mean±SE: 331±123); high dose group: 63.1 to 181 (mean±SE: 97.7±12.8)]. Results are expressed as % of baseline and symbols and bars are mean ± SE. *Significantly different from baseline by repeated measures ANOVA, P<0.05.

