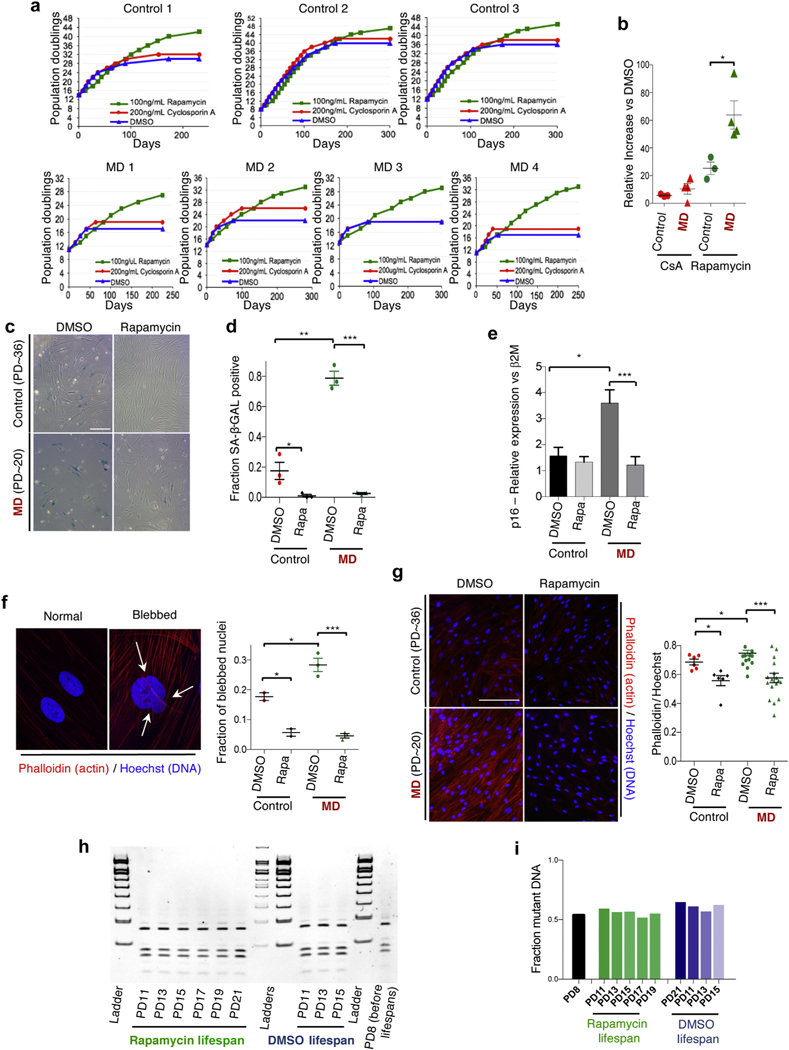
Figure 2|. Mechanistic target of rapamycin (mTOR) inhibition attenuates replicative capacity defects in primary mitochondrial encephalopathy with lactic acidosis and stroke-like episodes/maternally inherited diabetes and deafness (MELAS/MIDD) fibroblast lines.

(a) Replicative capacity data from 3 controls and 4 MELAS/MIDD fibroblasts treated with dimethylsulfoxide (DMSO), rapamycin, or cyclosporin A (CsA). (b) Relative change in the replicative capacity of CsA and rapamycin-treated control and MELAS/MIDD primary fibroblast lines versus DMSO treatment. (c) Representative senescence-associated β-galactosidase (SA-β-Gal) staining of low population doubling (PD) DMSO and rapamycin-treated MELAS/MIDD and control fibroblasts. (d) Quantification of SA-β-Gal staining (data points are representative of individual cell lines, ≥6 fields were assessed for each line). (e) Senescence-associated factor p16INK4a (p16) shows increased expression in MD fibroblasts, which was attenuated by 48 hours of rapamycin treatment. (f) Representative images of normal nuclei and nuclei showing nuclear blebbing (arrows indicate nuclear invaginations or blebs). Staining shows actin cytoskeleton (Phalloidin, red) and nuclei (Hoechst 33342, blue). Quantification of nuclear blebbing (data points are representative of individual cell lines, ≥6 fields were assessed for each line). (g) Staining for actin cytoskeletal organization (Phalloidin, red) and nuclei (Hoechst, blue). Quantification of nuclear cytoskeletal signal normalized to DNA content (data points are representative of individual cell lines, ≥6 fields were assessed for each line). (h) Mitochondrial m.3243A>G heteroplasmy analysis across the lifespan of MD line 2. Samples were collected every 2 population doublings and assessed together at the completion of the lifespan study. (i) Quantification of (h). Mitochondrial m.3243A>G heteroplasmy did not change in either DMSO- or rapamycin-treated cells throughout the duration of the lifespan studies. *P < 0.05, **P < 0.01, ***P < 0.001. Bar ~ 50 uM. To optimize viewing of this image, please see the online version of this article at www.kidney-international.org.
