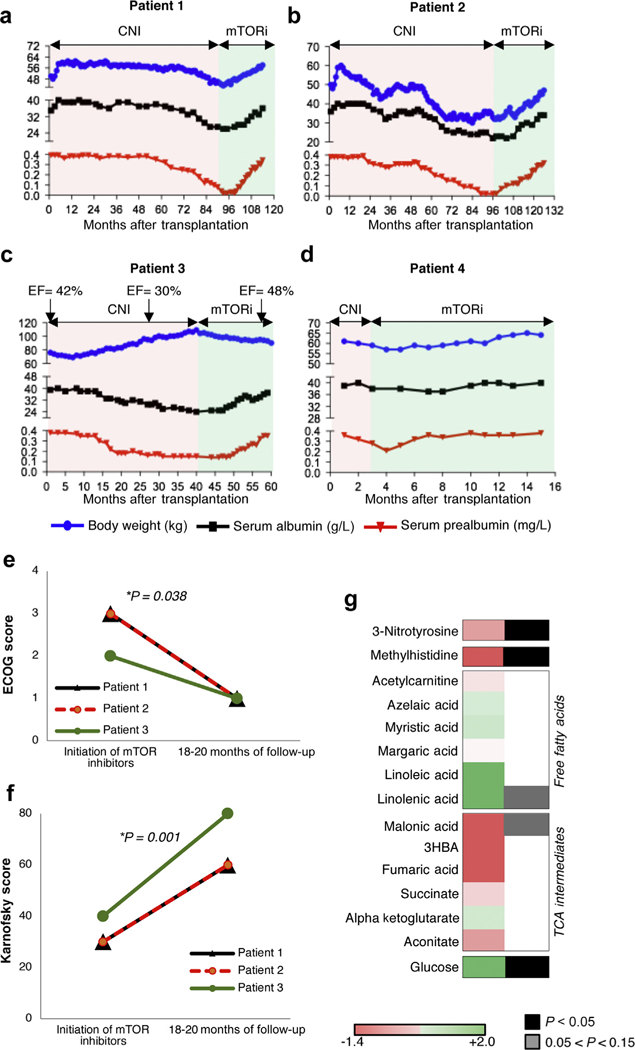
Figure 3|. Clinical and biological impact of mechanistic target of rapamycin (mTOR) inhibition in transplant recipients with mitochondrial encephalopathy with lactic acidosis and stroke-like episodes/maternally inherited diabetes and deafness (MELAS/ MIDD).

(a) Patient 1, (b) patient 2, (c) patient 3, and (d) patient 4. Pink parts of the graph show the period of exposure to calcineurin inhibitors (CNI), and green shows the period of exposure to mTOR inhibitors (mTORi). The blue dots show the body weight of the 4 patients over time, the black dots represent the serum albumin levels, and the red dots represent the serum prealbumin levels. In patient 3, the heart ejection fraction (EF, %) before and after the switch to mTOR inhibitors is added. (e) Eastern Cooperative Oncology Group (ECOG) and (f) Karnofsky scores at initiation of mTOR inhibitor treatment and at 18 to 20 months of follow-up evaluation. P values were calculated by paired t test. (g) Log10 average difference of amino acid metabolites levels between samples on sirolimus/everolimus and on calcineurin inhibitors.
