Abstract
Objective.
The polymer-induced liquid-precursor (PILP) mineralization process has been shown to remineralize artificial dentin lesions to levels consistent with those of native dentin. However, nanoindentation revealed that the moduli of those remineralized lesions were only ~50% that of native dentin. We hypothesize that this may be due to the PILP process having been previously optimized to obtain high amounts (~70wt%) of intrafibril-lar crystals, but without sufficient interfibrillar mineral, another significant component of dentin.
Methods.
Fluoride was added to the PILP-mineralization of collagen from rat tail tendon at varying concentrations to determine if a better balance of intra- versus inter-fibrillar mineralization could be obtained, as determined by electron microscopy. Nanoindentation was used to determine if fluoridated apatite could improve the mechanical properties of the composites.
Results.
Fluoride was successfully incorporated into the PILP-mineralization of rat tail tendon and resulted in collagenmineral composite systems with the mineral phase of hydroxya- patite containing various levels of fluoridation. As the fluoride concentration increased, the crystals became larger and more rod-like, with an increasing tendency to form on the fibril surfaces rather than the interior. Nanomechanical testing of the mineralized tendons revealed that fluoride addition did not increase modulus over PILP mineralization alone. This likely resulted from the separated nature of collagen fibrils that comprise tendon, which does not provide lateral reinforcement and therefore may not be suited for the compressive loads of nanoindentation.
Significance.
This work contributes to the development of minimally invasive approaches to caries treatment by determining if collagen can be functionally mineralized.
Keywords: Biomineralization, PILP, Apatite, Collagen, Fluoride, Hydroxyapatite, Fluorapatite
1. Introduction
Because of the short longevity of commonly used restorations, researchers are exploring biomimetic methods to restore less damaged areas of carious lesions to their natural state. While some success has been achieved for enamel repair, dentin remineralization poses a unique challenge given the large component of organic matrix [1–9]. In our prior report, when the polymer-induced liquid-precursor (PILP) process was used to remineralize artificial dentin caries, full apatitic mineral density recovery was obtained as determined by micro-x-ray computed tomography analysis (μ-CT) and similar nanostructures to native dentin were observed via transmission electron microscopy (TEM). However, nanoindentation analysis revealed that the modulus and hardness were not fully restored at the outer portions of the lesions, resulting in values ~50% of those of native dentin [10]. In the PILP process, anionic polypeptides (such as polyaspartic acid, pAsp) are placed in solution with supersaturated levels of calcium and phosphate. The acidic polypeptide sequesters ions to induce or stabilize nanodroplets of a liquid-like, amorphous calcium phosphate (ACP) precursor phase. These liquid-like precursors infiltrate collagen fibrils, perhaps by capillary action or via the Gibbs-Donnan effect [11,12]. After infiltration, the precursor solidifies into ACP and finally crystallizes into hydroxyapatite, resulting in large amounts of aligned, intrafibrillar mineral [11,13,14]. We hypothesize that we were unable to restore the mechanical properties due to preferential infiltration of PILP droplets into the interior of collagen fibrils, wherein the spatial confinement leads to very small, intrafibrillar crystals that may not provide sufficient hardness. Both intra- and interfib-rillar crystals are present in native dentin and are believed to augment the mechanical properties [15,16].
The work presented in this paper is to evaluate the effectiveness of adding fluoride to the PILP mineralization of type I collagen. We used rat tail tendon as a model system because it consists of relatively pure (~97%) and well-aligned type I collagen and our group has shown that it can be readily mineralized via the PILP process [17]. Given the larger dimensions of fluorapatite crystals, we hypothesized that these crystals would be unable to grow within the collagen fibrils and force them to associate more with the exterior surfaces of the fibrils, creating more inter- and/or extrafibrillar mineral than when no fluoride is present. In this paper, we use the terminology “intrafibrillar mineral” to refer to mineral that resides within the collagen fibrils, “interfibrillar mineral” as that which is located between the fibrils, and “extrafibrillar mineral” when describing crystals that do not appear to be templated by the fibrils (i.e., superficial spherulites).
Fluorapatite has a lower solubility product (8.6 × 10−61) than hydroxyapatite (2.35 × 10−59) and is thus less likely to dissolve in aqueous/mildly acidic environments [18–22]. This lower solubility is the reason why fluoride is used in enamel remineralization. Fluoride induces remineralization of partially demineralized enamel, so it was of interest here to see if that would also be the case for dentin. Fluorapatite is also harder and stiffer than hydroxyapatite and tends to create more rod-like crystals than hydroxyapatite, which is more platelike [23–28]. This study was designed to examine the effect of fluoride on the PILP system, which we hypothesized would increase mechanical properties of the resultant composite by both increasing the amount of interfibrillar mineral relative to intrafibrillar mineral and also by having a stiffer mineral component present within the composite material.
2. Materials and methods
2.1. Sample preparation
Tendons were extracted from tails of 12–18 week old Sprague Dawley rats and cleaned by centrifugation at 4400 rpm for 5 min in PBS two to three times, replacing the supernatant after each centrifugation cycle. The specimens were then placed in 4M NaCl (Fisher Scientific) solution for 5 min and then placed in a 0.5 M Tris buffer solution containing 0.5 M ethylenediaminetetraacetic acid (EDTA, Fisher) for 72 h under constant stirring [29]. The tendons were then rinsed in deionized water for 1.5 h, replacing the water every 30 min while continually shaking. They were rinsed for an additional 24 h in deionized water and then stored in PBS with 0.5 mg sodium azide (Fisher) at 4°C until use. Just before addition to the mineralization solutions, pieces 1.5” long were cut with a degreased razor blade.
2.2. Mineralization
Specimens were mineralized in 50 mM Tris buffer with 0.9% NaCl, 0.02% sodium azide, 4.5 mM CaCl2, 2.1mMK2HPO4, 50 μg/mL 27kDa pAsp (200-mer, Alamanda Polymers), and 0, 0.5, 1, 2, 5, 25, 50, 100, or 200 ppm F (powdered NaF, Acros Organics). Tris buffer solution containing 0.9% NaCl and 0.02% sodium azide was prepared. This solution was divided in half and CaCl2 (9 mM) was added to one half while K2HPO4 (4.2 mM) and NaF was added to the other. The solutions were filtered with 0.22 μm filter paper. pAsp was added to the CaCl2 solution and stirred for 5 min. The two solutions were then stirred together for 5 min before adding the scaffolds. Mineralizations took place for 7 days with 5 1.5” long pieces of rat tail tendon per 500 mL of solution at 37 °C with continual stirring. After mineralization, specimens were rinsed in deionized water three times for 30 min each while continuously shaking. The specimens were then flash frozen in liquid nitrogen and lyophilized for further characterization. All data presented in this paper is the result of one mineralization experiment per group, but the authors have performed these mineralization experiments a few different times with similar results.
2.3. X-Ray diffraction (XRD)
Samples were pulverized in liquid nitrogen and then placed on a glass slide for analysis with a PANalytical X’Pert Powder instrument. The samples were scanned from 10° to 60° (2θ) with a step size of 0.01° and a dwell time of 10 s/step using Cu Kα x-rays ( λ= 1.54Å).
2.4. Thermogravimetric analysis (TGA)
TGA was performed in a nitrogen atmosphere at a heating rate of 20 °C/min up to 600 °C using a TA Instruments Q600. Sample weights were ~4mg.
2.5. Scanning electron microscopy & energy dispersive x-ray spectroscopy (SEM/EDS)
Freeze-dried samples were mounted on SEM stubs and then sputter coated with amorphous carbon before analysis with an FEI XL-40 SEM operated at 15 kV and a spot size of 3.
2.6. Transmission electron microscopy & selected area electron diffraction (TEM/SAED)
Freeze-dried samples were pulverized in liquid nitrogen and then dispersed in ethanol. A drop of ethanol suspension was dispensed onto a 400 mesh copper grids coated with an amorphous carbon film (Electron Microscopy Sciences), with the grid placed atop filter paper. The samples were analyzed with either a JEOL 200CX or 2010F TEM at an accelerating voltage of 200 kV.
2.7. Electron tomography (ET)
ET was performed on the same samples imaged via conventional TEM using a Tecnai G2 F20-Twin TEM (FEI) operated at a voltage of 200 kV. The samples were tilted from −70° to 70° and an image was taken every 2°. A movie was constructed using eTomo in IMOD.
2.8. Differential thermal analysis (DTA)
A Mettler-Toledo TGA/DSC 2 STAR system was used with sample masses of 10–15 mg. Analyses were run from 25 °C to 600 °C with a heating rate of 20 °C/min under 36% oxygen and 64% argon. A blank DTA curve was subtracted from each sample DTA curve using Mettler-Toledo STARe Excellence software. The blank DTA curve was obtained by running ~4mg of blank sample under the same conditions. The blank sample was made by collecting precipitates from a mineralization solution without fluoride or pAsp that was incubated at 37 °C for 48 h. The blank sample (apatitic mineral) was collected via vacuum filtration and air dried.
2.9. Fluorine concentration determination
Fluorine concentrations in the samples were determined using the methods described in McCann [30]. Briefly, a known mass of sample (2–4mg) was dissolved in 1mL of 0.5 M perchloric acid (Ricca Chemical) for 1h. 4mL of 0.5 M trisodium citrate (Fisher) was then added to the solution. Fluoride concentrations within the solution were determined using a fluoride selective electrode and a digital pH/millivolt meter (model 801A, Orion Research) with standard solutions prepared by dissolving PILP-mineralized collagen sponges, adding the trisodium citrate solution, and adding known amounts of fluoride between 1 and 20 ppm. A standard curve was created by plotting the mV reading versus log (F concentration) and a linear curve was fit to these data. R2 values for the low ppm standard curve (0.5 ppm F-5ppm F) and high ppm standard curve (5 ppm F-20 ppm F) were 0.9681 and 0.9921, respectively. Fluorine concentrations within the samples (per amount of both collagen and mineral) and within the mineral only (using mineral percentage data from TGA) were back-calculated from the solution concentration and known amount of sample dissolved in the solution.
2.10. Nanoindentation
Specimens were embedded in EpoxiCure (Buehler). The blocks were cut to expose cross-sections of tendon pieces using a low speed water-cooled diamond saw (Buehler). The surfaces of the blocks were ground with SiC abrasive papers from 320 to 1200 grit and then polished with aqueous diamond suspensions (Buehler) of 6.0, 3.0,1.0, and 0.25 μm sizes. Before analysis, samples were hydrated in deionized water for one hour. Nanoindentation was performed on a Triboin- denter (Hysitron) using a diamond Berkovich indenter with a radius of curvature <100 nm. Fused silica was used to calibrate the transducer under dry and wet conditions. Reduced elastic modulus measurements were made using a controlled force of 300 μN with a 3-s trapezoidal loading profile (load, hold, and unload). Indentations were made every 4 μm starting at the edge of the specimen piece and moving toward the center, to a depth of 48 μm (n = 3 lines, for a total of 36 indentations per group). Average and variance of the elastic moduli were calculated using all data points collected. One-way ANOVA and Tukey’s post-hoc tests were performed to determine statistical significance between groups.
2.11. Atomic force microscopy (AFM)
Peak-force tapping mode was applied for imaging with simultaneous quantitative nanomechanical imaging (QNM) using a Bruker Multi Mode 8 with Nanoscope V scanner. Silicon cantilevers (Tap 525, Bruker) were calibrated for deflection sensitivity and tip radius using human intertubular dentin (elastic modulus of ~20GPa). Specimens were embedded in epoxy resin, sectioned, and polished as described previously. Specimens were fixed with superglue to an AFM specimen holder, imaged, and analyzed in the hydrated state.
3. Results
Apatitic peaks were seen in all specimens via x-ray diffraction (Supplemental Fig. 1). The peaks generally increased in sharpness as F concentration increased. Figs. 1–5 show SEM and TEM micrographs, electron dispersive x-ray spectroscopy (EDS) spectra, and selected area electron diffraction (SAED) patterns of the different groups. Fig. 1 shows SEM and TEM micrographs of tendon mineralized with pAsp but without fluoride (control group). There appears to be a large amount of intrafibrillar mineral present via EDS as well as interfibrillar mineral in some areas where the fibrils seem to be cemented together. The fibrillar morphology is well defined, unlike the RTT collagen prior to mineralization, which appears as a smooth mat with less distinct fibrils (Supplemental Fig. 2A & B). In the TEM images, dark areas indicate the presence of mineral as these samples were not stained. Some of the intrafibrillar crystals appear to be small, particularly in Fig. 1D, where individual crystals are not easily seen. Collagen fibrils in tendon are 100–200 nm in diameter, so the TEM micrograph in Fig. 1D appears to show two fibrils that have been cemented together. The SAED patterns show that the [1] axes of these apatitic crystals are roughly aligned with the long axes of the collagen fibrils (as is seen in native dentin), which seems to include the interfibrillar mineral as well. Some less well-mineralized fibrils were also occasionally seen via TEM (Supplemental Fig. 3).
Fig. 1.
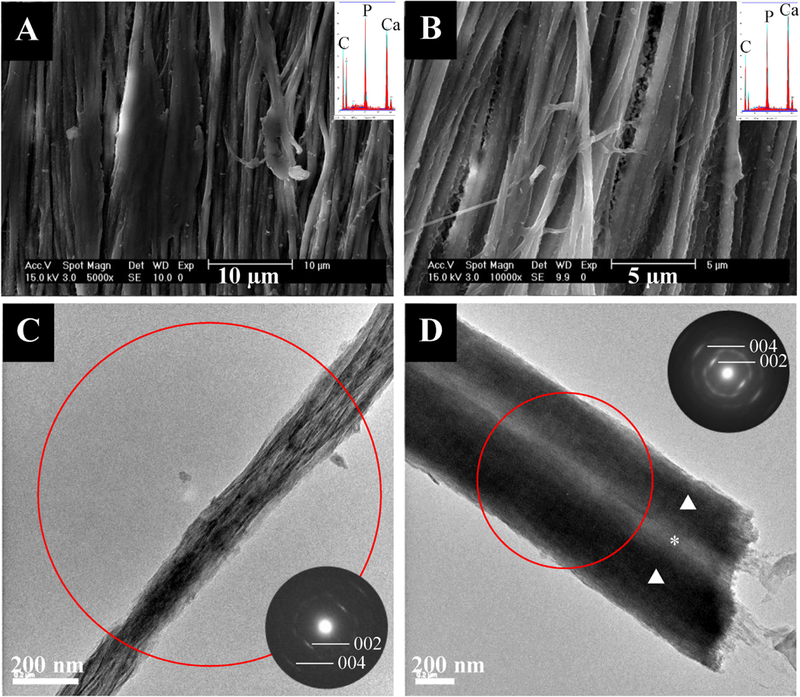
- SEM (top) and TEM (bottom) micrographs of tendon mineralized with 27 kDa pAsp for 7 days without fluoride with their respective EDS spectra and SAED patterns as insets. SEM micrographs show fibrils with high amounts of intrafibrillar mineral and some inter- or extrafibrillar mineral. TEM micrographs and SAED show highly aligned intrafibrillar apatite crystals. The red circle in this and the following figures represents the region from which the SAED pattern was taken. The triangles indicate regions of intrafibrillar mineral while the asterisk indicates where interfibrillar mineral is present.
Fig. 5.
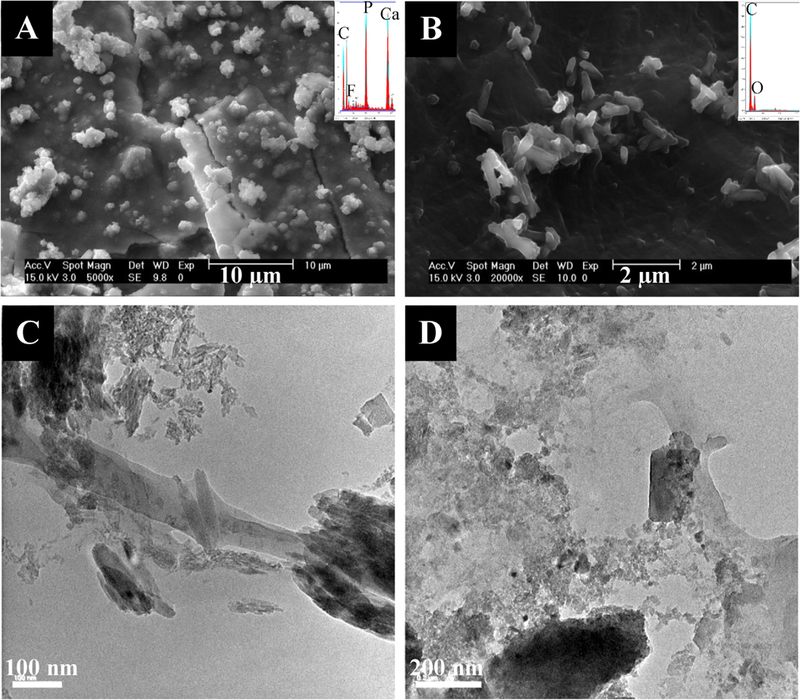
- SEM (top) and TEM (bottom) micrographs of tendon mineralized with 27 kDa pAsp for 7 days in the presence of 100 ppm F (left) or 200 ppm F (right) with their respective EDS spectra and SAED patterns as insets. (A) SEM micrograph of 100 ppm F group showing a thick mineral crust covering the surface of the specimen. Although this is extrafibrillar crust, it differs from the crust that forms via the conventional crystallization reaction (PILP solution without stabilizing polymer or F added), which creates densely packed spherulites of platy HA crystals. A F peak has become visible in the EDS spectra (inset). (B) SEM micrograph of 200 ppm F group showing very little mineralization, with only a sprinkling of rod-like crystals on the surface of the specimen. The low mineral content of this specimen results in EDS spectra without the presence of visible Ca or P peaks (inset). (C) TEM micrograph of 100 ppm F group showing a mix of granular and rod-like extrafibrillar crystals and little or no intrafibrillar mineral. (D) TEM micrograph of 200 ppm F group showing a mix of granular and very large rod-like extrafibrillar crystals and little or no intrafibrillar mineral.
In the 0.5 ppm group, the mineral appeared to be primarily intrafibrillar, with highly aligned apatitic nanocrystals (Fig. 2A & C). However, occasional granular crystals not associated with collagen were also seen in TEM (Supplemental Fig. 4A). In the 1ppm group, the mineral was again primarily intrafibrillar, with highly aligned apatitic crystals (Fig. 2B & D). However, the fibrils appeared to be bundled together in TEM micrographs, probably held together by interfibrillar mineral (Fig. 2D). Some large, extrafibrillar rod-like crystals were seen via TEM, along with some small granular crystals (Supplemental Fig. 4B). SEM micrographs of the 1 ppm F group showed bright patches along the fibrils that appeared rougher and like a mineral crust (Fig. 2B). TGA revealed that this group had less overall mineral content than the 0.5, 2, and 5 ppm groups (67.5 ±2.2 wt.% compared with 75.8 ±2.2, 74.9 ±2.2, and 83.5 ±2.2 wt.%, respectively), so the strong contrast difference between the regions may indicate there is less mineral inside the fibrils relative to the patches of external coating (Table 1). The 2 ppm group showed a large amount of both intra- and interfibrillar mineral as well as some extrafibrillar (non-collagen associated) mineral (Fig. 3A & C). As expected, the collagen-associated crystals were apatitic and their [1] axes were roughly aligned with the long axes of the collagen fibrils (Fig. 3C). Like the 1ppm group, TEM micrographs showed many pieces 400–500 nm in diameter, which are likely multiple fibrils held together by interfibrillar mineral (Supplemental Fig. 5A). Additionally, there were a few areas of less well-mineralized collagen, as is seen in all samples, suggestive of a non-homogeneous distribution of mineral throughout the bulk of the specimens (Supplemental Fig. 5B). The 5 ppm group still appeared to contain aligned, intrafibrillar crystals and interfibrillar coating, but the coating was now dominated by larger grains and distinct pieces of extrafibrillar crystals (Fig. 3B & D). The TEM micrographs showed that large, rod like and granular extrafibrillar crystals were present (Fig. 3D & Supplemental Fig. 5C), particularly when the crystals did not appear to be associated with collagen (Supplemental Fig. 5D).
Fig. 2.
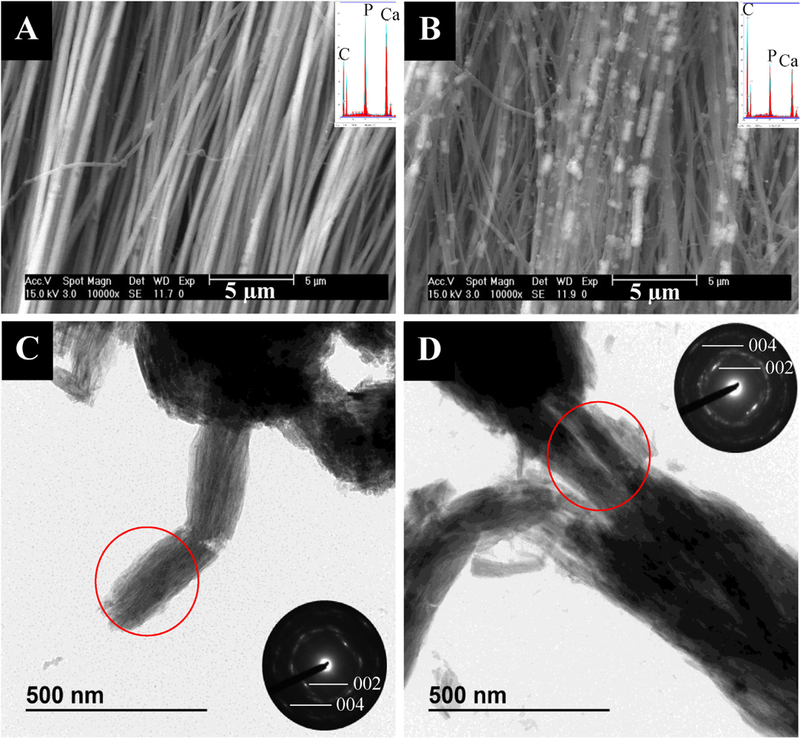
- SEM (top) and TEM (bottom) micrographs of tendon mineralized with 27 kDa pAsp for 7 days in the presence of 0.5 ppm F (left) or 1 ppm F (right) with their respective EDS spectra and SAED patterns as insets. (A) SEM micrograph of 0.5 ppm F group showing little to no extrafibrillar mineral, thus indicating that the 75.8 wt.% mineral (determined by TGA) must be predominantly intrafibrillar. (B) SEM micrograph of 1 ppm F group showing intra- and extrafibrillar mineral. (C) TEM micrograph and SAED pattern of 0.5 ppm F group showing some extrafibrillar granular crystals and highly aligned intrafibrillar apatite crystals. (D) TEM micrograph and SAED pattern of 1 ppm F group showing a crushed bundle of three fibrils, and well aligned intra- and interfibrillar apatite crystals.
Table 1.
– Mineral weight percentages determined by thermogravimetric analysis. All values are ±2.2 wt.%
| sample | mineral amount |
|---|---|
| 0 ppm F | 73.6 wt.% |
| 0.5 ppm F | 75.8 wt.% |
| 1 ppm F | 67.5 wt.% |
| 2 ppm F | 74.9 wt.% |
| 5 ppm F | 83.5 wt.% |
| 25 ppm F | 76.5 wt.% |
| 50ppm F | 79.7 wt.% |
| 100 ppm F | 40.0 wt.% |
| 200 ppm F | 34.5 wt.% |
Fig. 3.
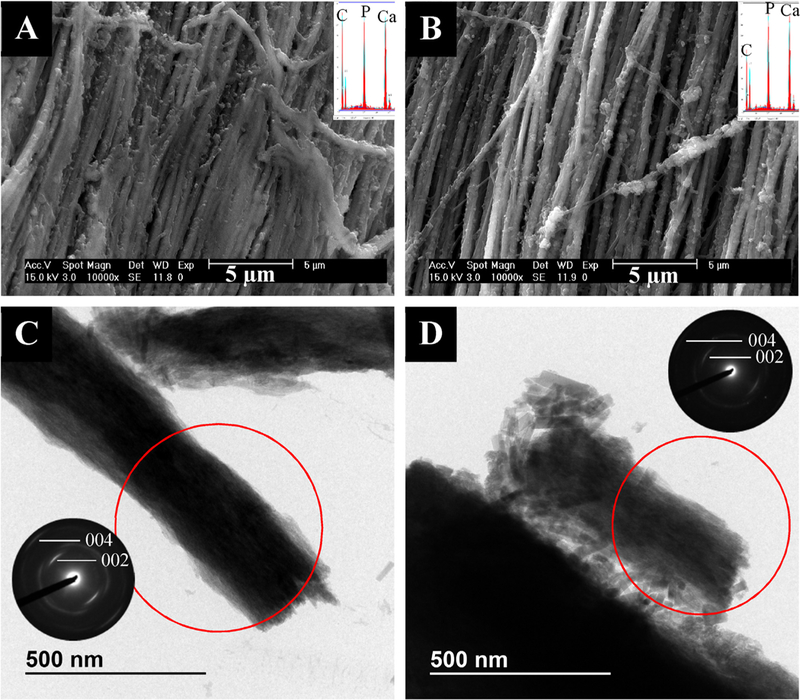
- SEM (top) and TEM (bottom) micrographs of tendon mineralized with 27 kDa pAsp for 7 days in the presence of 2 ppm F (left) or 5 ppm F (right) with their respective EDS spectra and SAED patterns as insets. (A) SEM micrograph of 2 ppm F group showing a large amount of both intra- and interfibrillar mineral. (B) SEM micrograph of 5 ppm F group showing larger, extrafibrillar crystals. (C) TEM micrograph and SAED pattern of 2 ppm F group showing some larger extrafibrillar,rod-like and granular crystals and highly aligned intrafibrillar apatite crystals. (D) TEM micrograph and SAED pattern of5 ppm F group showing a large number of extrafibrillar, rod-like crystals and some aligned intrafibrillar apatite crystals.
When more fluoride was added to the mineralization solution, very little intrafibrillar mineral was observed (the fibrils do not appear dark in TEM). In the 25 ppm group, fibrils appeared to be cemented together with a lumpy, interfibril- lar mineral coating via SEM (Fig. 4A). However, TEM revealed primarily extrafibrillar, rod-like and granular crystals, with little to no evidence of intrafibrillar mineral (Fig. 4C & Supplemental Fig. 6). This group appeared very heterogeneous compared to the other groups, exhibiting a large variety of crystal sizes and shapes (Supplemental Fig. 6). In the 50 ppm group, SEM micrographs showed fibrils with a very rough texture and primarily extrafibrillar mineral agglomerates on their surfaces (Fig. 4B). TEM micrographs showed fibrils with little to no intrafibrillar mineral and agglomerates of both granular and large, rod-like crystals surrounding the fibrils (Fig. 4D). The 100 and 200 ppm groups had much less mineral compared with the other groups (40.0 ± 2.2 and 34.5 ±2.2wt.%, respectively). SEM micrographs of the 100 ppm group showed what appears to be a thick mineral coating on the surface of the substrate (Fig. 5A). TEM analysis showed a similar nanostructure to the 50 ppm group, with primarily extrafibrillar crystals. In Fig. 5C, a couple of large crystals appear to be within a fibril, judging by the deformed collagen surrounding them. Electron tomography was performed to determine if the large, rod-like crystals were actually residing within the fibrils (Videos 1–3). It seems that the crystals were actually not inside the collagen, but were associated with the surfaces of the fibrils or poking through the fibrils, perhaps from sample preparation for TEM. SEM micrographs of the 200 ppm group showed large, rod-like crystal agglomerates on the surfaces of the collagen substrates but without a thick crust so there was very little mineral via EDS (Fig. 5B). The TEM micrographs looked similar to the 50 and 100 ppm groups, with little to no intrafibrillar mineral and agglomerates of granular and rod-like crystals (Fig. 5D). It is also important to note that as fluoride concentration in the mineralization solution increased, the solutions were stabilized for a shorter amount of time, as seen by visual cloudiness and precipitation at earlier time points.
Fig. 4.
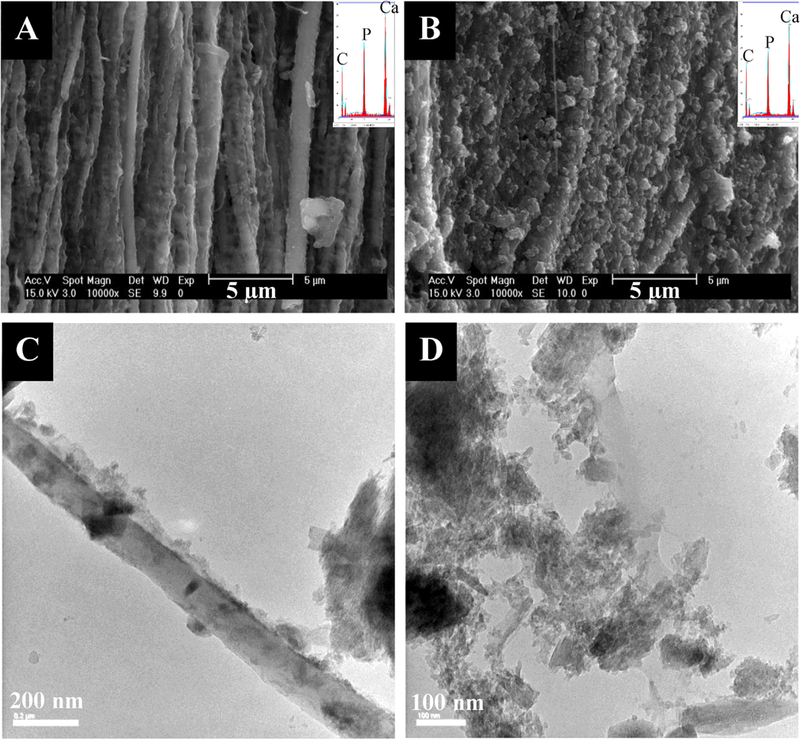
- SEM (top) and TEM (bottom) micrographs of tendon mineralized with 27 kDa pAsp for 7 days in the presence of 25 ppm F (left) or 50 ppm F (right) with their respective EDS spectra and SAED patterns as insets. (A) SEM micrograph of 25 ppm F group showing a nodular texture of fibrils, perhaps from mineral precursor droplets/particles that have coated the fibrils. (B) SEM micrograph of 50 ppm F group showing a large amount of extra- or interfibrillar mineral agglomerates which appear to be composed of nondescript, non-faceted globules, perhaps from PILP droplets that did not fully coalesce into a smooth coating as in B. (C) TEM micrograph of 25 ppm F group showing extrafibrillar crystals and no clear evidence of intrafibrillar mineral. (D) TEM micrograph of 50 ppm F group showing a mix of granular and rod-like extrafibrillar crystals and little or no intrafibrillar mineral.
Specimen mineral contents from TGA are given in Table 1. Mineral amounts are high and similar to those found in native dentin (67.5–83.5 wt.% versus ~70wt.%, respectively) for all samples except the 100 and 200 ppm groups. Fig. 6 shows DTA curves of the specimens. From literature, exothermic collagen peaks between 250 and 450 °C correspond to collagen decomposition while exothermic peaks between 450 and 700°C correspond to collagen combustion [31]. In this study, the mineralized specimens appeared to undergo decomposition and the unmineralized specimen appeared to mainly undergo combustion. The 0,0.5,1, and 2 ppm F groups showed collagen decomposition peaks ~320–330 °C. The decomposition peak in the 2 ppm F group was much sharper than those of the other samples. The 5 ppm F group had a collagen decomposition peak at 336 °C and the 25 ppm F group had a collagen decomposition peak at 345 °C. Unmineralized rat tail tendon exhibited a broad collagen combustion peak at 542 °C. Higher fluoride groups were not tested due to their similarities to the 25 ppm F group via TEM analysis.
Fig. 6.
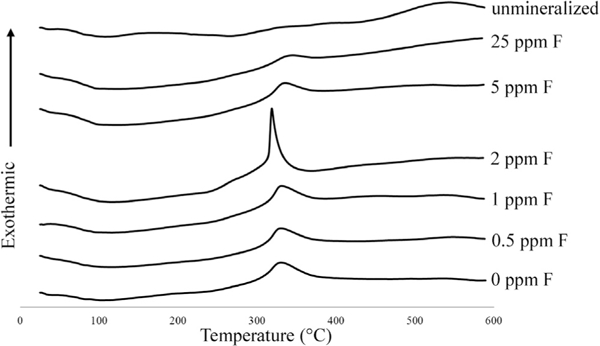
- DTA curves of samples mineralized with 27 kDA pAsp and 0, 0.5,1, 2, 5, or 25 ppm F. Collagen decomposition peaks were at 320–330 ◦ C for the 0ppm, 0.5 ppm, 1ppm, and 2 ppm F groups. This peak shifts slightly to higher temperatures with higher fluorine concentrations (335.7 °C for 5 ppm F and 345.3 °C for 25 ppm F). Unmineralized collagen combusted at 542.3 °C. All values have a standard instrument error of ±0.3 °C.
Fluorine concentrations within the samples are given in Table 2. Large amounts of fluorine were incorporated into the samples and the fluorine concentrations within the mineral component increased as solution fluoride concentration increased. Fig. 7 shows the elastic moduli for hydrated, mineralized specimens from nanoindentation. Unmineralized specimens are not shown here, but had an average modulus of 37 ±10 MPa. The 0ppm F group had the highest modulus, 8.5 ±5.2GPa. The 0.5 ppm and 50 ppm F groups had lower moduli of 5.6 ± 2.0 and 5.2 ± 4.3 GPa, respectively. Of the groups tested, the 2 ppm F group had the lowest modulus of 2.6 ± 1.0 GPa. Figs. 8 and 9 show height and modulus data from AFM analysis of cross-sections of the 0.5 ppm F group and unmineralized tendon, respectively.
Table 2.
– Fluorine concentrations determined by mineral dissolution in acid and measurement using a fluoride selective electrode. Middle column shows amount of fluorine per amount of sample (both organic and mineral phases). Right column shows amount of fluorine per amount of mineral within the sample.
| Sample | ppm F within sample |
ppm F within mineral phase of sample |
|---|---|---|
| 0.5 ppm | 3890 | 5120 |
| 1 ppm | 7610 | 11,200 |
| 2 ppm | 11,400 | 15,200 |
| 5 ppm | 25,400 | 30,300 |
| 25 ppm | 24,300 | 32,000 |
| 50 ppm | 27,800 | 34,700 |
Fig. 7.
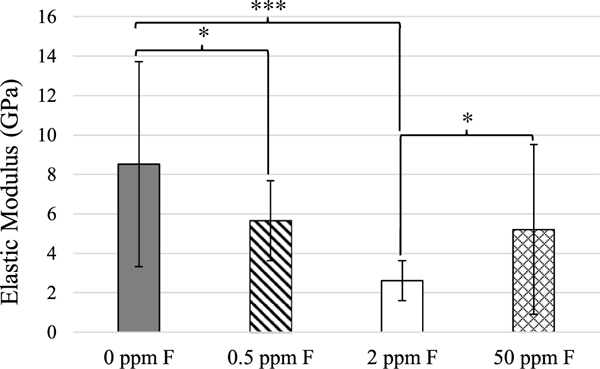
- Average elastic moduli of hydrated, mineralized specimens from nanoindentation. White: 0ppm F, E = 8.5 ±5.2 GPa; diagonal lines: 0.5 ppm F, E = 5.6 ± 2.0 GPa; grey: 2 ppm F, E = 2.6 ±1.0 GPa; crosshatch: 50 ppm, E = 5.2 ± 4.3 GPa. *p < 0.05, ***p < 0.005.
Fig. 8.
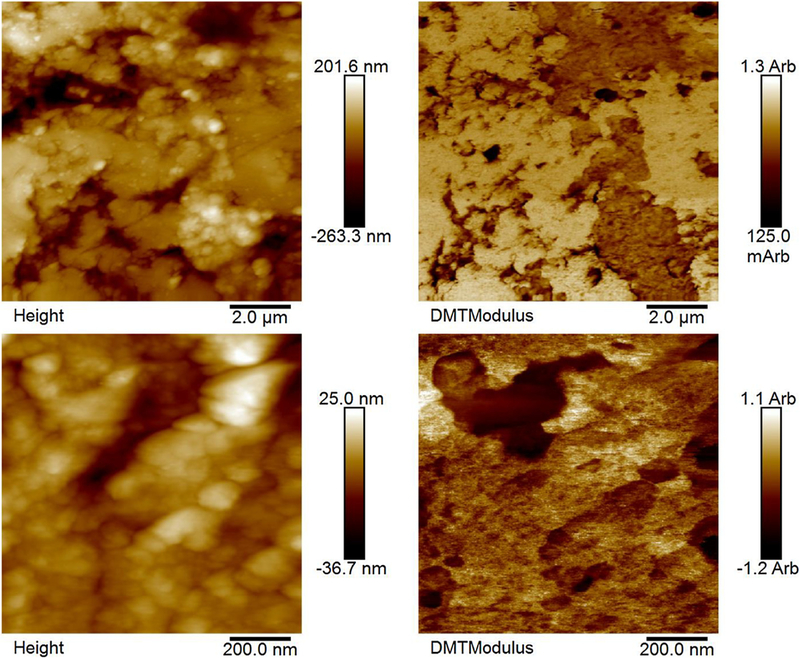
- Height (left) and modulus data (right) from AFM analysis of two different regions in the 0.5 ppm F group. The remineralized tendons were embedded in resin with their cross-sections exposed to the surface plane, polished, and then rehydrated prior to scanning. These data show general heterogeneity of mineralization. Fibrils sticking out from the surface of the resin to a larger degree tended to show lower moduli (arbitrary units), likely due to a smaller presence of mineral allowing the fibrils to swell more after the embedding and polishing procedure. However, this trend is not always seen because the topography can also be due to fibril pull-out from polishing.
Fig. 9.
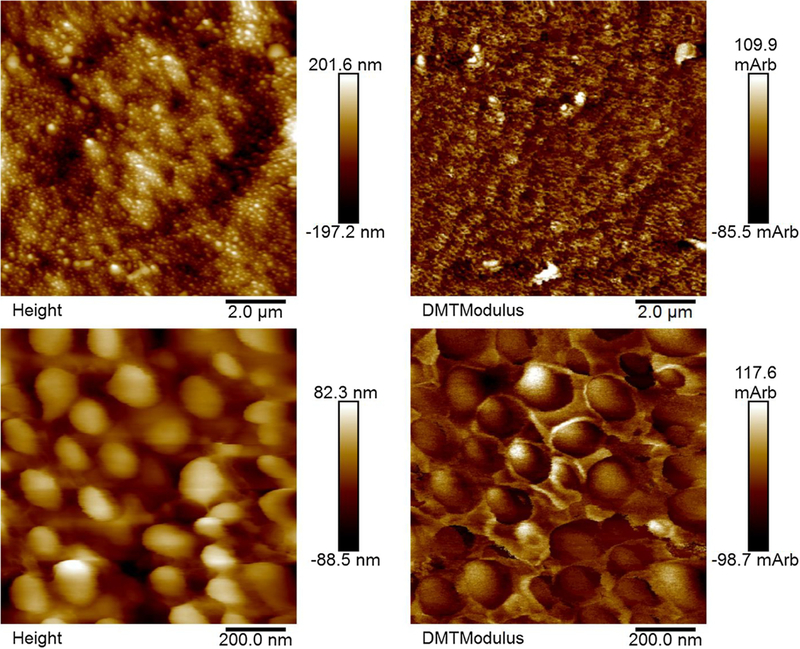
- Height (left) and modulus data (right) from AFM analysis of hydrated, unmineralized rat tail tendon. Fibrils sticking out from the surface of the resin to a larger degree tended to show lower moduli (arbitrary units).
4. Discussion
In general, the apatitic XRD peaks were broad and similar to those of native dentin (Supplemental Fig. 1). Some of the higher fluorine content specimens exhibited sharper peaks, which is likely due to larger crystal sizes, as was seen in TEM (Figs. 3–5). Neither SAED nor XRD instruments used in these studies had high enough resolution to distinguish between hydroxyapatite and fluorapatite. In the 200 ppm F group, possible evidence of calcium fluoride (fluorite) was seen in the electron diffraction patterns of some isolated crystals (Supplemental Fig. 7), but in XRD of bulk specimens, peaks for fluorite could not discerned, likely because there was not enough present in the sample to contribute to the signal. As solution fluoride concentration increased, more and larger rod-like crystals were observed (Figs. 3–5), which is likely indicative of more fluorapatite being present given that it commonly forms rod-like (hexagonal prismatic) crystals [26,28]. The rod-like crystals seemed preferentially located outside of fibrils, probably due to their large size not allowing them to fit between adjacent tropocollagen molecules within fibrils. Alternatively, it may be that the precursor phase containing higher levels of F ions may not infiltrate the fibrils as readily. In any case, these rod-like crystals and extrafibrillar crusts seen in the fluoridated samples are quite different from the extrafibrillar hydroxyapatite produced by the conventional mineralization (without polymer), where the hydroxyapatite crystals are typically platelets that grow into a spherulitic form (Supplemental Fig. 2C). These fluoride containing PILP reactions seem to produce an inter- or extra-fibrillar crust that is more like a granular coating or cement.
As fluoride concentration in solution increased, fluorine concentration in the mineral phase of the specimens also increased. These levels were quite high, even for the 0.5 ppm F group, which contained over 5000 ppm fluorine in the mineral (Table 2). For reference, the amount of fluoride in drinking tap water is usually 0.7–1.2 ppm and the concentration of fluorine in native dentin is ~100 −1000 ppm [32,33]. Pure fluorapatite should contain 37,700 ppm F. The mineral portions of our samples all contain less than 35,000 ppm F and have apatitic XRD patterns, thus the morphological changes seem to suggest they are a mixture of hydroxyapatite, fluoridated hydroxyapatite, and possibly some fluorapatite in the samples with increasingly higher levels of fluoride content [34].
A general trend was seen that as fluoride solution concentration increased, more inter- and extrafibrillar crystals were obtained, which fits with our initial hypothesis. This is particularly evident via electron micrographs (Figs. 1–5). Though there is some evidence of interfibrillar mineral in the 0 ppm group, the area in between the fibrils is lighter than the area where the fibrils presumably reside, suggesting that the mineral between the fibrils is not as thick as the fibrils are (Fig. 1D). This implies that the precursor phase may have preferentially wicked into the fibrils to form primarily intrafibrillar mineral. In contrast, when low levels of fluoride were added to solution, we see a trend in which more and thicker interfibrillar mineral is present; this is particularly evident in the 1, 2, and 5 ppm groups in which we see what appear to be very large well- infiltrated collagen fibrils (Figs. 2D, 3C and D and Supplemental Fig. 5A).
The ratio of intrafibrillar to inter/extrafibrillar mineral may also be evident in the DTA data (Fig. 6). The 0 ppm F group exhibited a collagen decomposition peak at 330 °C, which is similar to previous results published of PILP remineralization of bone [35]. We believe this is indicative of intrafibrillar mineral because in those studies, native bone exhibited an exothermic peak at 337 ° C, PILP-remineralized bone at 318 ° C, demineralized bone at 500 ° C, and bone remineralized without a process directing agent at 548°C [35]. We know that native bone contains intrafibrillar mineral, demineralized bone is largely devoid of mineral, and bone remineralized without a process-directing agent (just supersaturated calcium and phosphate concentrations) leads to almost exclusively extrafibrillar mineral [11]. Therefore, we expect the exothermic collagen degradation peak to occur at higher temperatures with more extrafibrillar mineral present. So if we examine these DTA curves, the collagen decomposition peaks for the 0, 0.5, 1, and 2 ppm groups occurred at ~320–330 °C. As fluoride concentration increased, the collagen decomposition peak also increased (335.7 °C for 5 ppm F and 345.3°C for 25 ppm F). We believe this may be indicative of more extra/interfibrillar and less intrafibrillar mineral being present. Interestingly, the decomposition peak for the 2 ppm F group was significantly sharper and occurred at a lower temperature than all the other groups (and this was repeated twice for verification; data not shown).
Counter to our hypothesis on the expected increase of modulus with F content, the 0 ppm F group exhibited the highest elastic modulus via nanoindentation, 8.5 ±5.2 GPa (Fig. 7). This modulus is ~50% of that of native dentin (16–20 GPa), which is consistent with previous results of the PILP-remineralization of artificial dentin lesions [10,36]. The average modulus of the 0.5 ppm F group was 5.6 ±2.0 GPa, which was significantly lower than the 0ppm F group (p<0.05). It is strange that this group appears to be so similar to the 0ppm F group, yet exhibits a significantly lower modulus. It is possible that the reason for this lies in the size of the crystals, which seem like they may be larger than those in the 0ppm F group, as judging by the TEM micrographs and the SAED patterns that show less continuous arcs as compared with those from the 0 ppm F group, indicating that they may be composed of fewer crystals (Figs. 1C & D vs. 2C). If the crystals are slightly larger overall, this could mean that there is slightly more interfibrillar mineral than intrafibrillar mineral, which would result in a lower measured modulus when the indenter indents into the interior of the fibril as the fibril could deform laterally, along its short axis, if there is not sufficient intrafibrillar mineral. Due to its similarity to the 2 ppm F group, the 1 ppm F group was not tested via nanoindentation. The 2 ppm F group, exhibited the lowest modulus of all groups tested: 2.6 ±1.0 GPa (Fig. 7). This group appeared to have larger crystals than the 0 and 0.5 ppm F groups, as judging from the TEM micrographs, which may be the reason for the lower modulus if the crystals were less uniformly located in the sample and the rigid regions could move laterally if surrounded by softer regions. Thus, conclusions from these nanoindentation results are limited due to the overall heterogeneity of mineralization. However, the modulus of this group is still increased over unmineralized tendon (37 ± 10 MPa) by two orders of magnitude. The 50 ppm F group also had a lower modulus than the 0 ppm F (control) group, which again likely has to do with the presence of larger crystals. The 100 and 200 ppm F groups were not tested due to their micro- and nanostructures being far removed from native dentin. It is also possible that the presence of intrafibrillar mineral is more important for elastic modulus than interfibrillar mineral, so F addition does not provide a positive contribution for this system and there could be other reasons PILP remineralization without F only recovers 50% modulus; for instance, crystal sizes and shapes from the PILP phase my differ from those in native dentin [37]. However, we cannot yet come to any conclusions with this data because rat tail tendon may not be a suitable model system for examining mechanics given the distinctly isolated fibrils, which are unlike those found in dentin. We had chosen to use tendon because we wanted to investigate structural changes upon mineralization (such as crystal size, shape, and location), which are more easily identified in TEM with isolated fibrils. But tendons are designed for bearing tensile loads, so the compressive type of deformation in nanoindentation may have led to misleading outcomes for this system. In the past, we have successfully analyzed nanomechanical properties of PILP-remineralized dentin and compressed collagen sponges, where these scaffolds are comprised of a more isotropic organization of the collagen constrained by a network of fibrillar linkages throughout [10,38], so in the future we plan to retest the F system using native dentin as the scaffold.
Fig. 8 shows height and modulus data from AFM analysis of crosssections of the 0.5 ppm F group. The fibrils seem to be 100–150 nm in diameter and the specimens do not appear very homogeneously mineralized. The major trend is that the fibrils extending from the surface generally have lower moduli likely because they swelled more when the samples were rehydrated due to less mineral being present. The topographies of the specimens are likely also due to pull-out of some of the fibrils during polishing. This is evident because the overall roughness is similar between the 0.5 ppm F group (75.8 ±2.2wt.% mineral) (Fig. 8) and unmineralized tendon (Fig. 9). AFM was used to assess the heterogeneity of the groups. Given the unexpectedly low modulus values for the specimens that were highly mineralized, we did not examine all of the samples. Heterogeneity is also evident in TEM micrographs (Supplemental Figs. 3–6).
From TGA, the 100 and 200 ppm F groups were not highly mineralized (40.0 ±2.2wt.% and 34.5 ±2.2wt.%, respectively) whereas all other groups exhibited mineral contents close to native dentin, ~70wt.% (Table 1). The low mineral contents in the 100 and 200 ppm F groups may be due to the lower solubility of fluorapatite (and fluorite) compared with hydrox- yapatite. Thus, in these systems, there may not be enough polymer in solution to stabilize amorphous precursor droplets long enough for them to enter collagen fibrils. This would drive fluorapatite/fluorite to nucleate quickly within the solution instead of being created intrafibrillarly. Therefore, there would be more mineral in solution rather than associated with the scaffolds, as was evidenced by the fact that these solutions precipitated more quickly than when less fluoride was present.
5. Conclusion
In this study, we were able to successfully incorporate fluoride ions into the PILP-mineralization of type I collagen. In the 1, 2, and 5 ppm F groups, both interfibrillar and large amounts of highly aligned, intrafibrillar apatitic mineral formed. This may have resulted in nanostructures more similar to that of native dentin than when the PILP process alone was used. However, the addition of fluorapatite/fluoridated hydroxyapatite to the composite system as well as the increase in interfibrillar mineral did not result in increased modulus measurements. This, however, may be due to the particular collagen scaffold used in these studies (rat tail tendon), which has a different collagen organization that may not provide the interconnectivity between fibrils that is needed for carrying compressive loads applied via nanoindentation. In the future, similar experiments to those presented here will be conducted on artificial dentin lesions. From a clinical standpoint, this type of mineralization system could be more beneficial to the patient than a system that creates primarily hydroxyapatite mineral because fluorapatite/fluoridated hydroxyapatite is less likely to dissolve, even under mildly acidic conditions, decreasing the chances of cavity formation in vivo.
Supplementary Material
Acknowledgments
Research reported in this publication was supported by the National Institute of Dental and Craniofacial Research (NIDCR) of the National Institutes of Health under Award Number 5RO1DE016849–07. The content is solely the responsibility of the authors and does not necessarily represent the official views of the National Institutes of Health. We thank the staff at the Research Service Centers within the Herbert Wertheim College of Engineering at the University of Florida for maintaining the characterization instruments used in this publication as well as the Polymer Chemistry Characterization Lab and Dr. Douglas Rodriguez for the TGA data. We would also like to thank Dr. Kyle Allen at the University of Florida for donating rat tails for this study, Dr. Chiayi Shen at the University of Florida for allowing us to use his fluoride selective electrode, and Dr. Jonathan Scheffe and his student, Conrad Cole, for the training and instrument use on the Mettler-Toledo TGA/DSC 2 STAR system. We would especially like to thank Paul Chipman and the Electron Microscopy core at the Interdisciplinary Center for Biotechnology Research at the University of Florida for the electron tomography micrographs and video creation.
Abbreviations:
- μ-CT
micro-x-ray computed tomography
- ACP
amorphous calcium phosphate
- AFM
atomic force microscopy
- DTA
differential thermal analysis
- EDS
energy dispersive x-ray spectroscopy, often coupled with electron microscopy to determine what elements makeup an area of a specimen
- EDTA
ethylenediaminetetraacedic acid, frequently used as a calcium chelator
- GPa
gigapascal
- kDa
kilodaltons, 1 kilodalton = 1 kg/mol
- MPa
megapascal
- pAsp
poly(aspartic acid)
- PBS
phosphate-buffered saline solution
- PILP
polymer-induced liquid-precursor
- ppm
parts per million
- SAED
selected area electron diffraction
- SEM
scanning electron microscopy
- TEM
transmission electron microscopy
- TGA
thermogravimetric analysis, usually involves the measurement of sample weight as ambient temperature is increased
- wt%
weight percentage
- XRD
x-ray diffraction
Footnotes
Appendix A. Supplementary data
Supplementary data associated with this article can be found, in the online version, at https://doi.org/10.1016/j.dental.2018.06.020.
REFERENCES
- [1].Li J, Yang JJ, Li J, Chen L, Liang K, Wu W,et al. Bioinspired intrafibrillar mineralization of human dentine by PAMAM dendrimer. Biomaterials 2013;34:6738–47. [DOI] [PubMed] [Google Scholar]
- [2].Wang T, Yang S, Wang L, Feng H. Use of multifunctional phosphorylated PAMAM dendrimers for dentin biomimetic remineralization and dentinal tubule occlusion. RSC Adv 2015;5:11136–44. [Google Scholar]
- [3].Chen C, Pan H, Chen Y.Mao C, Wang W, Tang R, et al. Biomimetic promotion of dentin remineralization using L-glutamic acid: inspiration from biomineralization proteins. J Mater Chem B 2014;2:4544–53. [DOI] [PubMed] [Google Scholar]
- [4].Niu L-N, Zhang W, Pashley DH, Breschi L, Mao J, Chen JH, et al. Biomimetic remineralization of dentin. Dent Mater 2014;30:77–96. [DOI] [PMC free article] [PubMed] [Google Scholar]
- [5].Kim J, Arola DD, Gu L, Kim YK, Mai S, Liu Y,et al. Functional biomimetic analogs help remineralize apatite-depleted demineralized resin-infiltrated dentin via a bottom-up approach. Acta Biomater 2010;6:2740–50. [DOI] [PMC free article] [PubMed] [Google Scholar]
- [6].Vollenweider M, Brunner TJ, Knecht S, Grass RN, Zehnder M, Imfeld T, et al. Remineralization of human dentin using ultrafine bioactive glass particles. Acta Biomater 2007;3:936–43. [DOI] [PubMed] [Google Scholar]
- [7].Chen Z, Cao S, Wang H, Li Y,Kishen A, Deng X, et al. Biomimetic remineralization of demineralized dentine using scaffold of CMC/ACP nanocomplexes in an in vitro tooth model of deep caries. PLoS One 2015;10(1):1–19, e0116553. [DOI] [PMC free article] [PubMed] [Google Scholar]
- [8].Cao Y Mei ML, Xu J, Lo ECM, Li Q, Chu CH. Biomimetic mineralisation of phosphorylated dentine by CPP-ACP. J Dent 2013;41:818–25. [DOI] [PubMed] [Google Scholar]
- [9].Lausch AJ, Quan BD, Miklas JW, Sone ED. Extracellular matrix control of collagen mineralization in vitro. Adv Funct Mater 2013;23:4906–12. [Google Scholar]
- [10].Burwell AK, Thula-Mata T, Gower LB, Habelitz S, Kurylo M, Ho SP, et al. Functional remineralization of dentin lesions using polymer-induced liquid-precursor process. PLoS One 2012;7. [DOI] [PMC free article] [PubMed] [Google Scholar]
- [11].Olszta MJ, Cheng X, Jee SS, Kumar R, Kim YY, Kaufman MJ, et al. Bone structure and formation: a new perspective. Mater Sci Eng R 2007;58:77–116. [Google Scholar]
- [12].Niu LN, Jee SE, Jiao K, Tonggu L, Li M, Wang L, et al. Collagen intrafibrillar mineralization a a result of the balance between osmotic equilibrium and electroneutrality. Nat Mater 2017;16:370–8. [DOI] [PMC free article] [PubMed] [Google Scholar]
- [13].Jee SS. Development of collagen-hydroxyapatite nanostructured composites via a calcium phosphate precursor mechanism In: Materials science and engineering. Gainesville: University of Florida; 2008. p. 218. [Google Scholar]
- [14].Gower LB, Odom DJ. Deposition of calcium carbonate films by a polymer-induced liquid-precursor (PILP) process. J Cryst Growth 2000;210:719–34. [Google Scholar]
- [15].Liu Y,Thomopoulos S, Chen C, Birman V,Buehler MJ, Genin GM. Modelling the mechanics of partially mineralized collagen fibrils, fibres and tissue. J R Soc Interface 2014:11. [DOI] [PMC free article] [PubMed] [Google Scholar]
- [16].Nikolov S, Raabe D. Hierarchical modeling of the elastic properties of bone at submicron scales: the role of extrafibrillar mineralization. Biophys J 2008;94:4220–32. [DOI] [PMC free article] [PubMed] [Google Scholar]
- [17].Buschmann J, Burgisser GM. Structure and function of tendon and ligament tissues In: Biomechanics of tendons and ligaments: tissue reconstruction and regeneration. Cambridge: Woodhead; 2017. p. 3–30. [Google Scholar]
- [18].Orlovskii VP, Komlev VS, Barinov SM. Hydroxyapatite and hydroxyapatite-based ceramics. Inorg Mater 2002;38:973–84. [Google Scholar]
- [19].ten Cate JM, Featherstone JDB. Mechanistic aspects of the interactions between fluoride and dental enamel. Crit Rev Oral Biol Med 1991;2:283–96. [DOI] [PubMed] [Google Scholar]
- [20].Aoba T The Effect of fluoride on apatite structure and growth. Crit Rev Oral Biol Med 1997;8:136–53. [DOI] [PubMed] [Google Scholar]
- [21].McCann HG. The Solubility of fluorapatite and its relationship to that of calcium fluoride. Archs Oral Biol 1968;13:987–1001. [DOI] [PubMed] [Google Scholar]
- [22].McDowell H, Gregory TM, Brown WE. Solubility of Ca5(PO4)3OH in the system Ca(OH)2-H3PO4 at 5,15, 25, and 37 °C. J Res Natl Bur Stand A Phys Chem 1977;81A:273–81. [Google Scholar]
- [23].Bianco A, Cacciotti I, Lombardi M, Montanaro L, Bemporad E, Sebastiani M. F-substituted hydroxyapatite nanopowders: thermal stability: sintering behaviour and mechanical properties. Ceram Int 2010;36:313–22. [Google Scholar]
- [24].Gross KA, Bhadang KA. Sintered hydroxyfluorapatites. Part III. Sintering and resultant mechanical properties of sintered blends of hydroxyapatite and fluorapatite. Biomaterials 2004;25:1395–405. [DOI] [PubMed] [Google Scholar]
- [25].Gilmore RS, Katz JL. Elastic properties of apatites. J Mater Sci 1982;17:1131–41. [Google Scholar]
- [26].Silva GWC, Ma L, Hemmers O, Lindle D. Micro-structural characterization of precipitation-synthesized fluorapatite nano-material by transmission electron microscopy using different sample preparation techniques. Micron 2008;39:269–74. [DOI] [PubMed] [Google Scholar]
- [27].LeGeros RZ, Trautz OR, LeGeros JP, Klein E, Shirra WP. Apatite crystallites effects of carbonate on morphology. Science 1967;155:1409–11. [DOI] [PubMed] [Google Scholar]
- [28].Olson TY, Orme CA, Han TY-J, Worsley MA, Rose KA, Satcher JH Jr, et al. Shape control synthesis of fluorapatite structures based on supersaturation: prismatic nanowires, ellipsoids, star, and aggregate formation. Cryst Eng Comm 2012;14:6384–9. [Google Scholar]
- [29].Gobeaux F, Belamie E, Mosser G, Davidson P, Panine P, Giraud-Guille M-M. Cooperative ordering of collagen triple helices in the dense state. Langmuir 2007;23:6411–7. [DOI] [PubMed] [Google Scholar]
- [30].McCann HG. Determination of fluoride in mineralized tissues using the fluoride ion electrode. Archs Oral Biol 1968;13:475–7. [DOI] [PubMed] [Google Scholar]
- [31].Bigi A, Ripamonti A, Cojazzi G, Pizzuto G, Roveri N, Koch MHJ. Structural analysis of turkey tendon collagen upon removal of the inorganic phase. Int J Biol Macromol 1991;13:110–4. [DOI] [PubMed] [Google Scholar]
- [32].Levy M, Leclerc B-S. Fluoride in drinking water and osteosarcoma incidence rates in the continental United States among children and adolescents. Cancer Epidemiol 2012;36:83–8. [DOI] [PubMed] [Google Scholar]
- [33].Nakagaki H, Koyama Y,Sakakibara YWeatherell JA, Robinson C. Distribution of fluoride across human dental enamel, dentine and cementum. Arch Oral Bio 1987;32:651–4. [DOI] [PubMed] [Google Scholar]
- [34].Albano MP, Garrido LB. Processing of concentrated aqueous fluorapatite suspensions by slip casting. J Mater Sci 2011;46:5117–28. [Google Scholar]
- [35].Thula TT, Rodriguez DE, Lee MH, Pendi L, Podschun J, Gower LB. In vitro mineralization of dense collagen substrates: a biomimetic approach toward the development of bone-graft materials. Acta Biomater 2011;7:3158–69. [DOI] [PMC free article] [PubMed] [Google Scholar]
- [36].Meyers MA, Chen P-Y. Calcium-phosphate-based composites In: Meyers MA, Chen P-Y, editors. Biological materials science: biological materials, bioinspired materials, and biomaterials. Cambridge: Cambridge University Press; 2014. p. 223–91. [Google Scholar]
- [37].Kinney JH, Habelitz S, Marshall SJ, Marshall GW. The importance of intrafibrillar mineralization of collagen on the mechanical propertie of dentin. J Dent Res 2003;82:957–61. [DOI] [PubMed] [Google Scholar]
- [38].Li Y,Thula TT, Jee S, Perkins SL, Aparicio C, Douglas EP, et al. Biomimetic mineralization of woven bone-like nanocomposites: role of collagen cross-links. Biomacromolecules 2012;13:49–59. [DOI] [PubMed] [Google Scholar]
Associated Data
This section collects any data citations, data availability statements, or supplementary materials included in this article.


