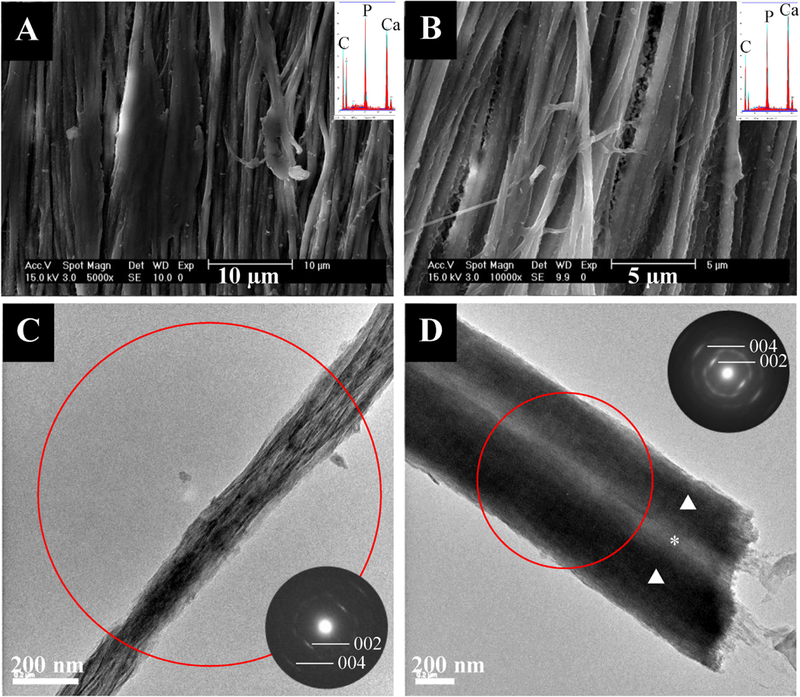
Fig. 1.

- SEM (top) and TEM (bottom) micrographs of tendon mineralized with 27 kDa pAsp for 7 days without fluoride with their respective EDS spectra and SAED patterns as insets. SEM micrographs show fibrils with high amounts of intrafibrillar mineral and some inter- or extrafibrillar mineral. TEM micrographs and SAED show highly aligned intrafibrillar apatite crystals. The red circle in this and the following figures represents the region from which the SAED pattern was taken. The triangles indicate regions of intrafibrillar mineral while the asterisk indicates where interfibrillar mineral is present.
