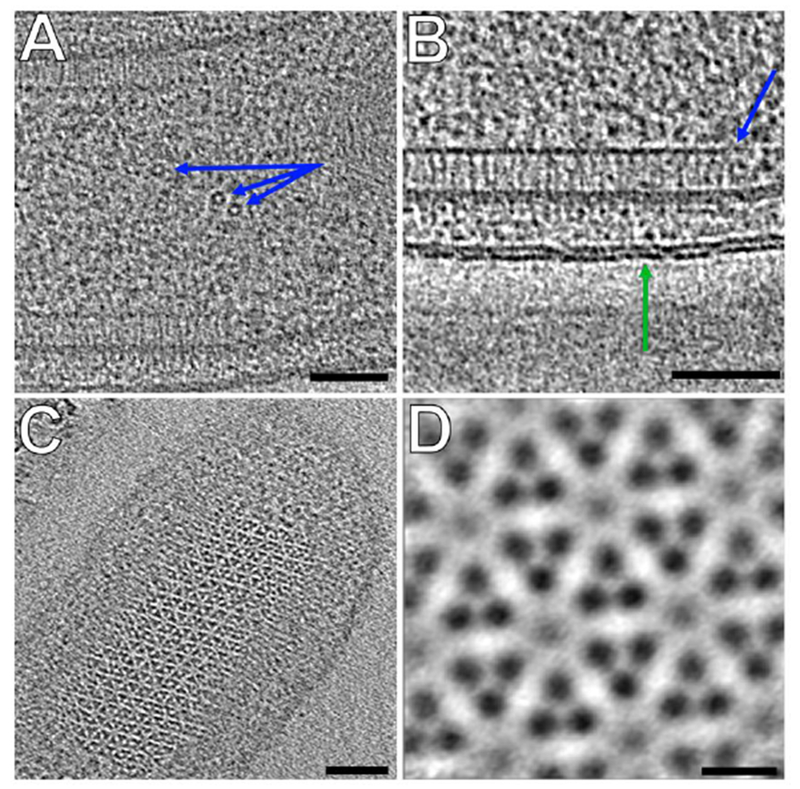
Figure 7 –

A, B and C) Observable features in a tomogram of Bdellovibrio bacteriovorus collected using the fast-incremental method, bi-directional scheme with 1° tilt increment. (Scale bars: 50nm). A) Side view of MCP array (blue arrow) and double leaflets of the outer membrane lipid bilayer (green arrow). B) Barrel-shaped protein complexes (blue arrows) C) Top view of MCP array D) Subtomogram average of MCP array shown in C (Scale bar: 5nm).
