Fig. 1.
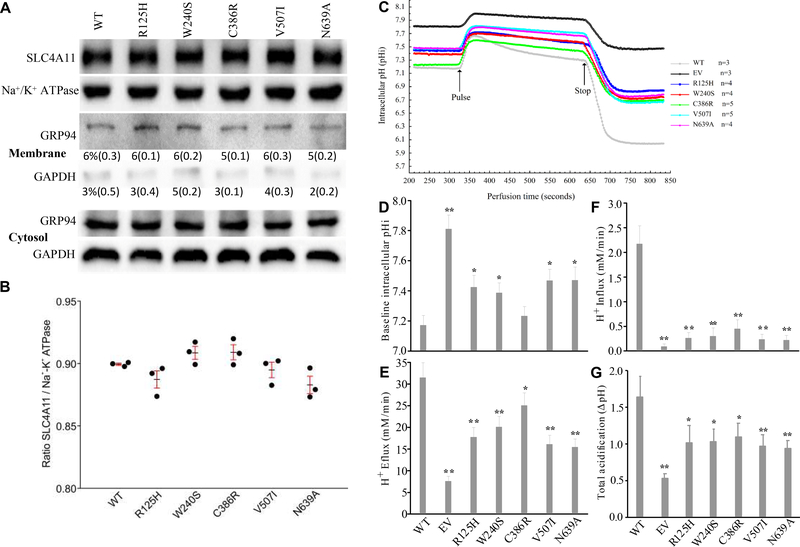
SLC4A11 expression in plasma membrane and H+ Flux. (A) Shows a representative western blot image of biotinylated SLC4A11 and (Na+/K+)-ATPase, selected from three independent experiments (n = 3). Procedure validation was performed by probing biotinylated and non-biotinylated fractions for GRP94, an ER resident protein, and cytosolic GAPDH. Percent in membrane fraction and (SD) are shown. (B) Plot of SLC4A11/(Na+/K+)-ATPase ratio for WT and each mutant showing the individual ratios from each experiment, the mean and SD, p>0.05. (C) The measurement of intracellular pH in PS120 cells. Average pHi traces from three or more independent experiments as indicated. Pulse with 10 mM NH4Cl was maintained for 300 seconds. (D) Baseline pHi. (E) H+ efflux during initial 10 seconds of NH4Cl pulse. (F) H+ influx in the presence of NH4Cl (between Pulse and Stop). (G) Total acidification which is the difference between baseline pHi and lowest pHi after removing NH4Cl. The values represent the average in n=3 tests and are shown as mean±SD. One-way ANOVA test in a comparison to WT, * indicates p < 0.05 and ** indicates p < 0.01.

