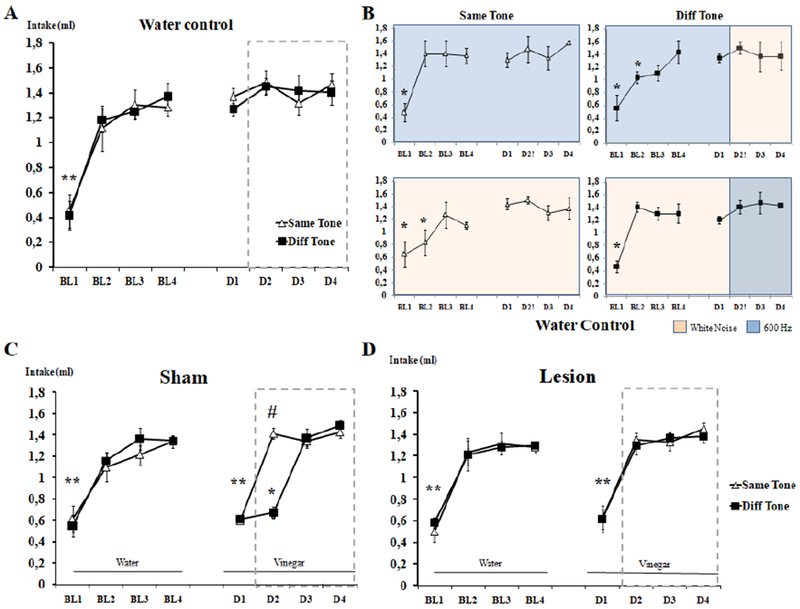
Figure 2.

Water intake (±SEM) across the experimental days A) in the water only control mice demonstrating no effect of changing the auditory background, and B) that there is no effect of the specific auditory backgrounds; and demonstrating attenuation of taste neophobia in C) sham and D) hippocampus lesion mice. *Symbol represents statistically significant differences compared to Day 4.** indicates that both the Same Tone and Diff Tone groups were statistically significant compared to Day 4. # Symbol represents statistically significant differences between groups. Dashed-line boxes represent the days in which the tone was changed for the Different groups only (in a counterbalanced way).
