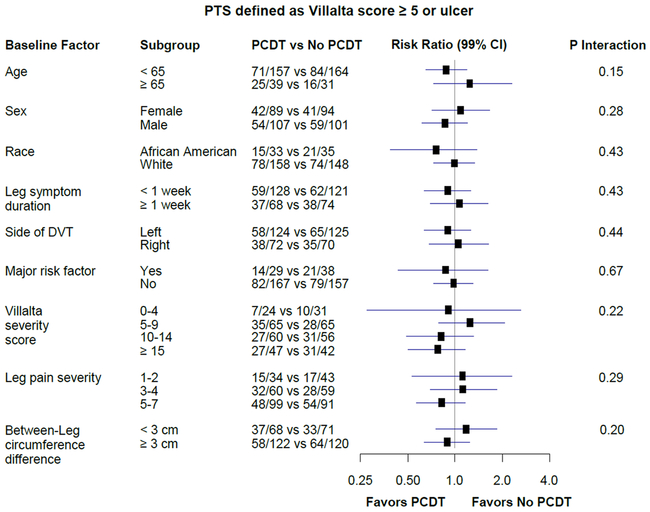
Figure 2. Subgroup analysis of PTS in patients with iliofemoral DVT.
Forest plot of risk ratios (PCDT versus No PCDT) for the occurrence of PTS from 6 to 24 months among subgroups of patients. The horizontal lines represent 99% confidence intervals.
PCDT, pharmacomechanical catheter-directed thrombolysis; DVT, deep vein thrombosis.

