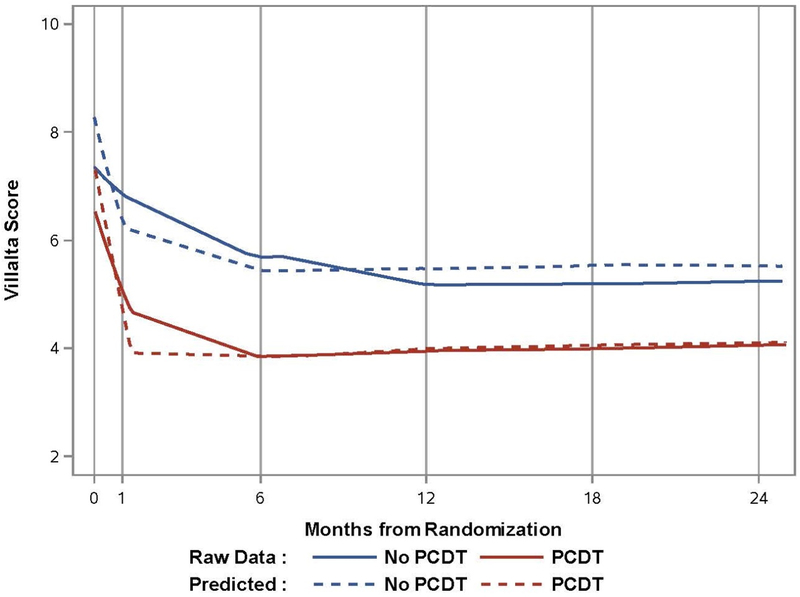
Figure 3: LOESS* of raw and predicted mean Villalta scores by treatment group.
Graphical display (locally weighted scatterplot smoothing) of the Villalta Scores evaluating PTS severity by treatment arm, derived from piecewise-linear growth-curve models of the repeated assessments from baseline through 24 months.

