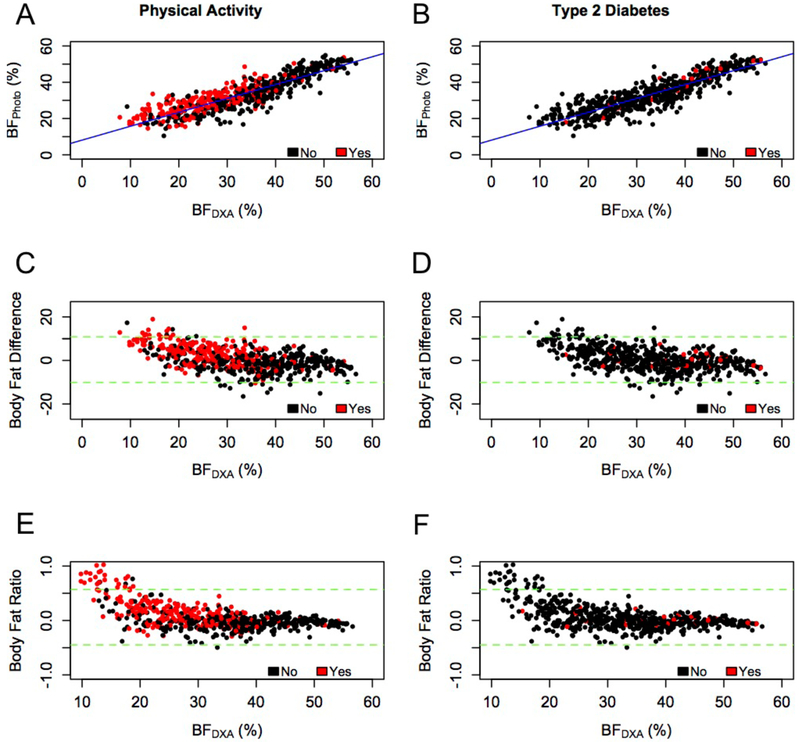
Figure 1:
Associations and Agreements Between the Two Body Fat Percentage Estimates. BFPhoto and BFDXA, by physical activity (left column) and type 2 diabetes (right column) outcomes for all participants (n=588). (A-B) BFPhoto strongly correlates with BFDXA (r=0.88, P < 0.0001). Bland-Altman tests with 95% confidence intervals (dashed green lines) for the (C-D) absolute difference BFPhoto - BFDXA and (E-F) relative difference (BFPhoto - BFDXA)/ BFDXA show that BFPhoto overestimated body fat percentage for individuals with lower body fat percentage

