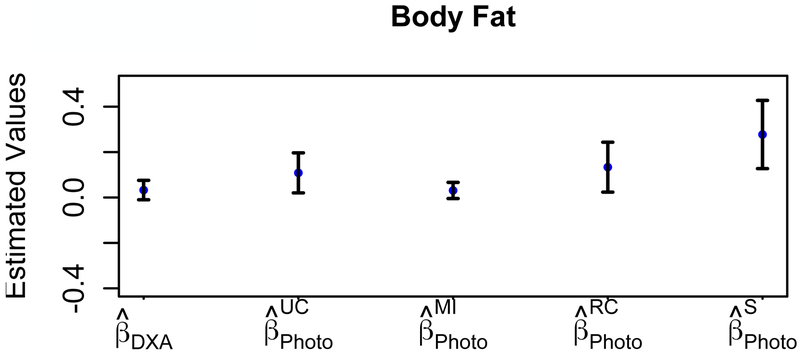
Figure 3:
Type 2 Diabetes Status Results. Parameters estimated with standard error bars for the probability of having type 2 diabetes are shown for the error-free measurement (DXA), the unadjusted error bias-adjusted measurement (UC, Photo), and the three measurement error bias-adjusted cases (MI, RC, and S).

