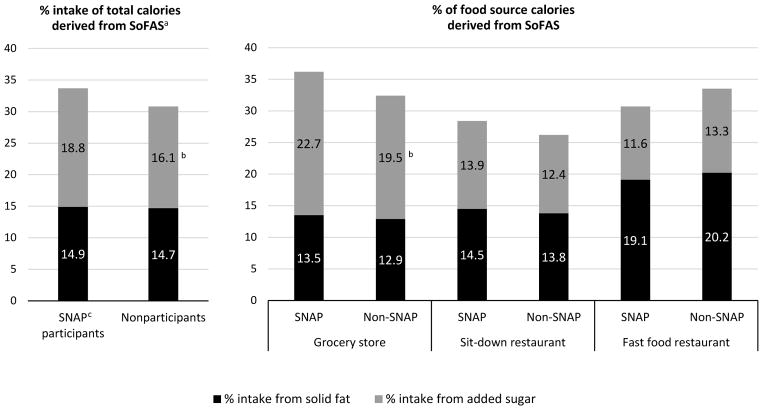
Figure 1.
Proportion of food source calories attributable to SoFAS, by SNAP participation
Legend: Data are for adults aged 20–64 years with an income at or below 130% of the Federal Poverty Limit from the National Health and Nutrition Examination Survey (NHANES) 2011–2012 and 2013–2014. The sample size for SNAP participants, defined as receipt of benefits in past 30 days, was 1,191 and 1,332 for income-eligible non-participants. Each nutrient outcome was calculated for each category of food source and included in a separate linear regression model. All models account for complex survey design and were adjusted for year, age (age, age2), sex, marital status, employment, race-ethnicity (Mexican American, non-Hispanic White, non-Hispanic Black (ref), Other), income (poverty income ratio), education (< high school (ref), high school, some college or college graduate or above), weekend consumption and participation in the Special Supplemental Nutrition Program for Women, Infants and Children (WIC). In order to calculate the percent of calories from a given source that are attributable to SoFAS, the calories from saturated fat or added sugar were divided by the total number of calories consumed from that source. Dietary data for solid fats and added sugars are from USDA Food Patterns Equivalents Database (FPED) 2011–2012 and 2013–2014. Added sugars are those used as ingredients in processed and prepared foods and do not include naturally occurring sugars. Discretionary solid fats include fats from animal sources or hydrogenated vegetable oils. aSoFAS=solid fats and added sugars bSignificant difference between SNAP participants and income-eligible non-participants at p<0.025 cSNAP=Supplemental Nutrition Assistance Program

