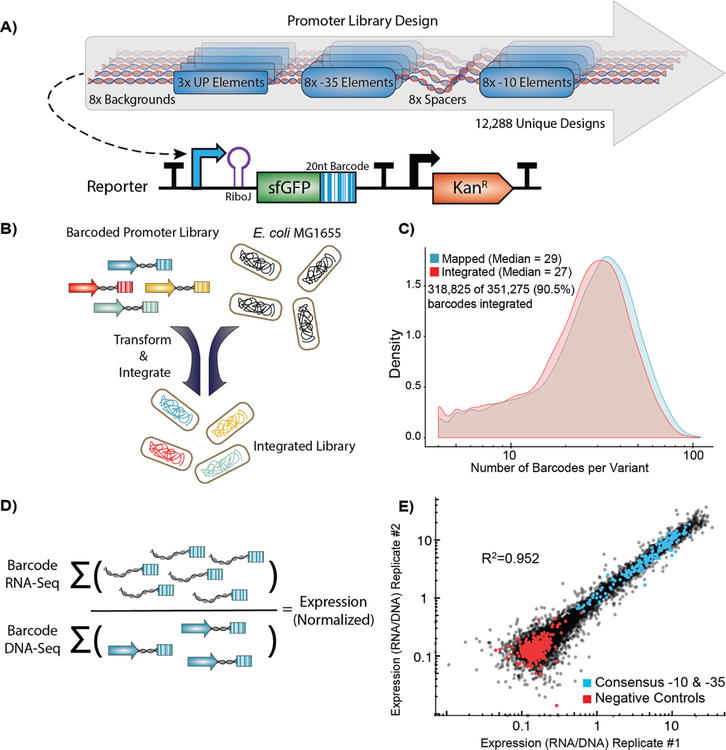
Figure 2. High-throughput quantification of σ70 promoter strength.
A) We designed and constructed a σ70 promoter library using an oligonucleotide microarray, and cloned the library into a custom-made reporter construct. The reporter contains a promoter to be tested, a RiboJ self-cleaving ribozyme sequence to standardize the reporter 5’ UTR, and an sfGFP coding sequence followed by a 20 nt barcode in the 3’ UTR that identifies the promoter variant. The exchange cassette also includes a constitutive kanamycin resistance marker downstream of the reporter for selection purposes. B) Pooled promoters are uniquely barcoded using PCR, cloned into the exchange vector, and integrated into the E. coli nth-ydgR locus as a library. C) Pre-integration barcodes are identified during mapping stage and integrated barcodes are identified when quantifying promoter strength using RNA-Seq and DNAseq. We found 90.5% of the barcodes that were observed in the mapping stage (blue histogram), were later observed in the integrated library (red histogram), and the overall distributions remained similar. D) Expression of each promoter is calculated as the sum of all RNA counts divided by the sum of all DNA counts for all barcodes mapped to a given promoter. E) Promoter strength measurements are highly correlated (R2=0.952, p < 2.2×10⁻¹⁶) between technical replicates and discriminate between negative controls and promoters with consensus core elements.

