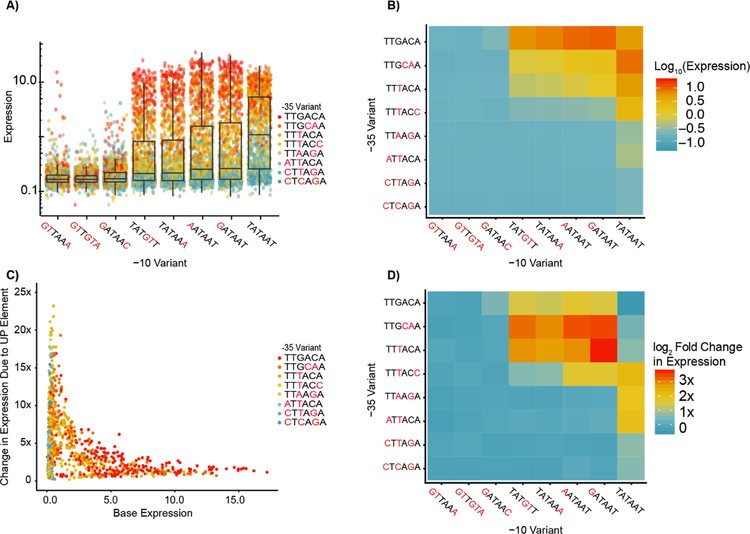
Figure 5. Identification of nonlinear interactions among promoter elements with direct RNAP Interactions.
A) We plot all promoters split by −10 element and colored by −35 element. The overall promoter expression increases approaching the consensus −10 and −35, yet the strongest expressing promoters with a consensus −10 tend not to be those with a consensus −35. B) The median expression of all promoters as a function of the −10 and −35 identity shows a similar general trend towards increased expression as −10 and −35 gets closer to consensus. However, median expression of promoters containing a combination of a consensus and mutant −10 and −35 elements is higher than promoters containing both consensus sequences. C) We plot the fold-change increase in expression due to the addition of the 326x UP element as a function of the expression of the promoter without the UP element. Weaker promoters have the greatest increase in expression upon addition of the consensus UP element. D) We show the median log2 fold-change in expression for all −10 and −35 element combinations upon addition of the 326x UP element. On average, expression of promoters containing consensus −10 and −35 elements drops by 15%.

