
Figure 2.
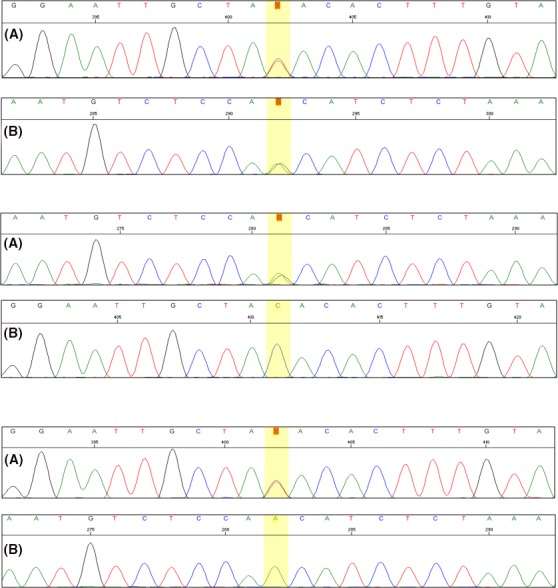
Sanger sequencing chromatograms of the HIBCH mutated regions in the patient (top) showing the heterozygous c.641C>T (A) and c.913A>G (B) variants, the patient's father (middle) showing the heterozygous c.641C>T variant (A) and the normal homozygous c.913A (B), and the patient's mother (bottom) showing the normal homozygous c.641C (A) and the heterozygous c.913A>G variant (B)