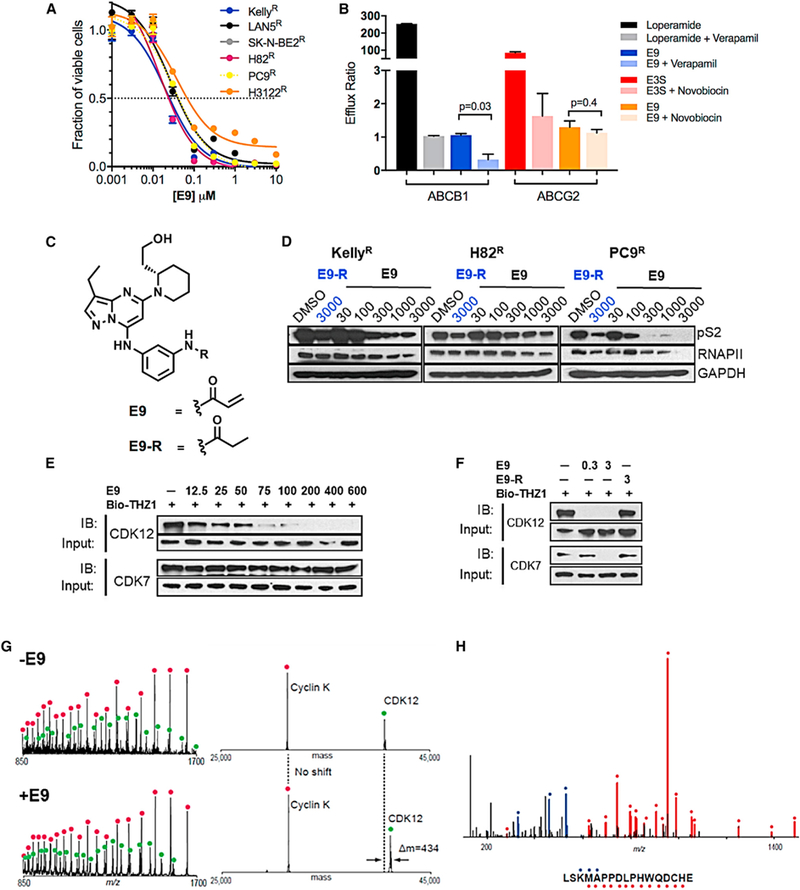
Figure 2. The Covalent Inhibitor E9 Overcomes ABC-Mediated Resistance.

(A) Dose-response curves for THZ1R NB and lung cancer cells treated with E9 for 72 hr. Error bars indicate means ± SD, n = 3. (B) In vitro permeability analysis of E9 as a substrate of ABCB1 and ABCG2. MDR1-MDCK cells stably expressing ABCB1 and Caco-2 cells stably expressing ABCG2 were exposed to E9 (10 μM) aloneorin combination with inhibitorsofABCB1,verapamil (100 μM) orABCG2, novobiocin (50 μM), respectively, for2hrand the amount of E9 acrossacell monolayerquantified by liquid chromatographytandem massspectrometry.An efflux ratio>2 indicatesthatthetest compound isa potential substrate for either ABC transporter. Loperamide and E3S (10 μM) were used as positive controls for ABCB1 and ABCG2, respectively. Error bars represent means ± SD of three experiments. (C) Structures of E9 and E9-R. (D) WB of RNAPII CTD phosphorylation at Ser2 in NB and lung cancer cells treated with E9-R (3 μM) or E9 at the indicated doses for 6 hr. (E) WB of unengaged CDK12 and CDK7 in THZ1R Kelly NB cells treated with E9 at the Indicated doses for 6 hr. Cell lysates were subjected to a target engagement assay in which biotinylated THZ1 (bio-THZ1; 1 μM) was used to label unengaged CDKs. (F) WB of unbound CDK12 and CDK7 in THZ1R Kelly cells treated with E9 (0.3 and 3 μM) or E9-R (3 μM) for 6 hr followed by bio-THZ1 (1 mM). See also Table S1 and Figures S4 and S5. (G) Mass spectra (left) and zero-charge mass spectra (right) derived from CE-MS analysis of the CDK12/CCNK complex after treatment with DMSO (upper panels) or E9 (lower panels) for 1 hr at room temperature. The mass of CDK12 shifts after treatment with inhibitor, indicating covalent labeling. (H) MS/MS spectrum of the CDK12 peptide (residues 1025–1041) acquired during CE-MS analysis of E9-labeled CDK12/CCNK complex that was digested with GluC. Ions of type b and y are illustrated with blue and red glyphs, respectively (C*, E9 modified cysteine residue). No other E9 modified peptides were detected in this analysis.
