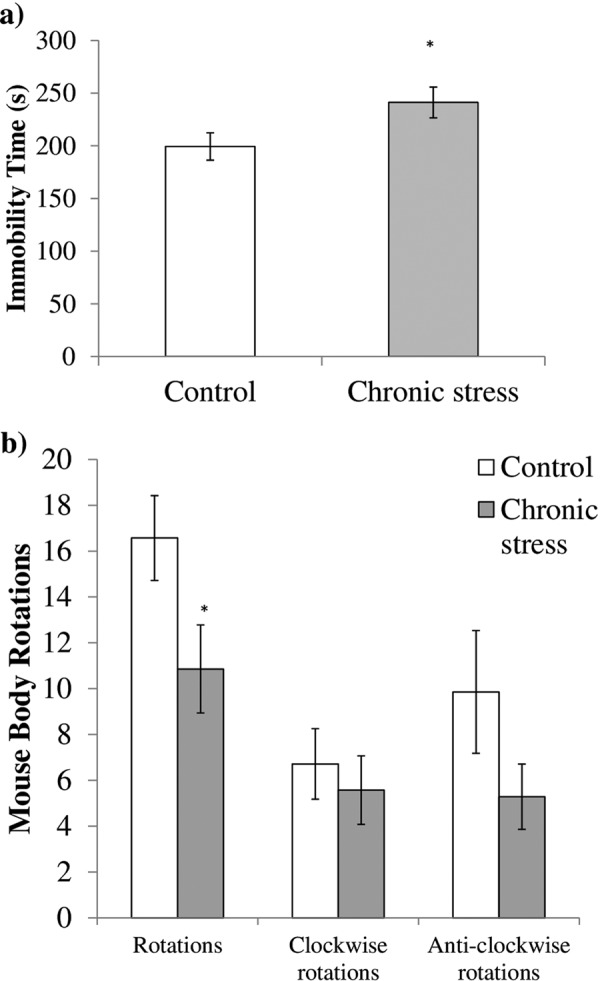
Fig. 2.

Forced-swim test performed on the stressed (n=7) and control (n=7) groups. (a) The stressed group showed a significant increase in the immobility time as compared with the control group, (b) Analysis of body rotations that occurred during the FST revealed that the stressed group had significantly fewer in overall body rotations compared with the control group. The data are expressed as the mean ± SEM. *P<0.05 vs. control.
