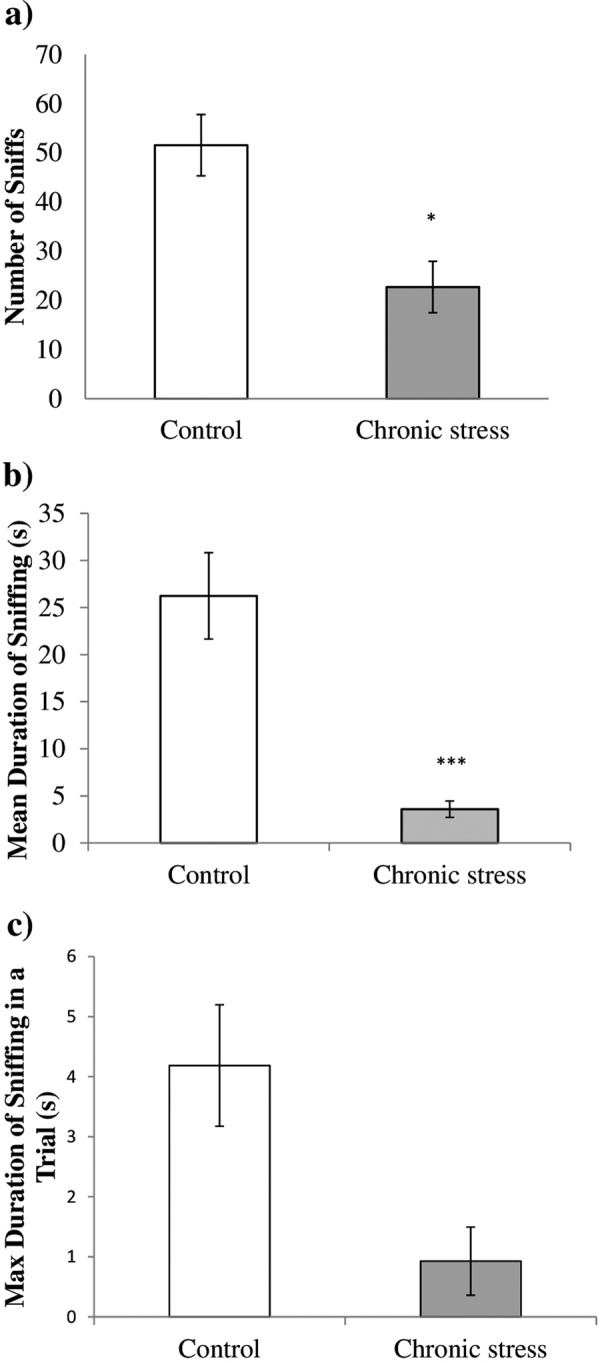
Fig. 4.

Comparison of sociability between the stressed group (n=7) and control group (n=7). (a) The stressed group showed a significantly low in number of sniffs toward stranger mouse 1 compared with the control. (b) The duration of sniffing toward stranger mouse 1 was significantly low in the stressed group compared with the control, which indicates a low intensity of sniffing. (c) The stressed group showed a significantly low maximum duration of sniffing as compared with the control, which indicates a low absolute intensity of sniffing. Data are presented as the mean ± SEM. *P<0.05 vs. control; **P≤0.01 vs. control; ***P≤0.001 vs. control.
