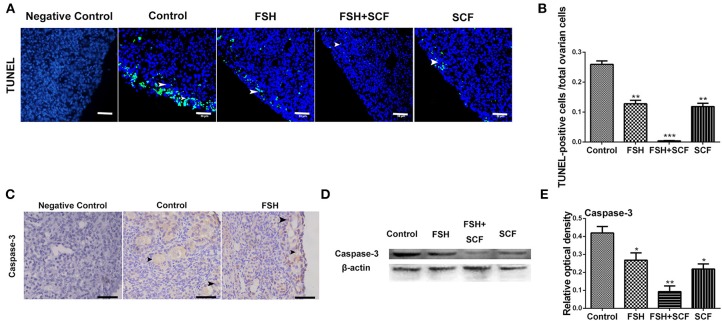
Figure 11.
Combined effects of FSH and SCF on cell apoptosis. (A) Ovarian cells (arrowheads) with TUNEL (green) marker indicate cell apoptosis after the treatment of 4-day-old chicken ovaries with FSH or SCF in vitro for 3 days. DAPI (blue) represents nuclear DNA. Scale bar: 30 μm. (B) The percentage of TUNEL positive cells reduced significantly after FSH and SCF treatment. (C) Caspase-3 protein is indicated by a brown stain. Arrowheads represent the ovarian cells stained caspased-3 marker. (D,E) Western blot and gray analysis indicate that FSH inhibited caspase-3 protein expression. SCF acted to enhance the effect of FSH in inhibiting caspase-3 expression in vitro. T-tests were used to determine statistically significant differences. The values are the mean ± SEM of six experiments. Asterisks indicate significant differences (*P < 0.05, **P < 0.01, ***P < 0.001).

