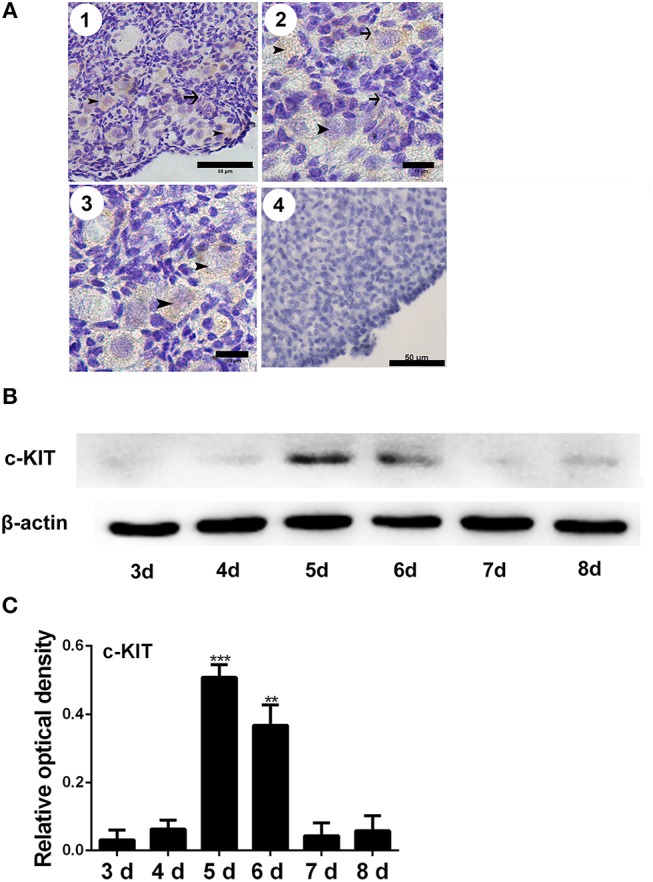
Figure 2.

Changes of c-KIT during primordial follicle formation. Brown staining indicates c-KIT, arrows, and arrowheads represent the somatic cells and oocytes, respectively, in 6-day-old chicken ovaries (A-1, scale bar: 50 μm). An enlarged picture is also included (A-2 and 3, scale bar: 10 μm). A negative control (A-4, scale bar: 50 μm). (B) Expression of c-KIT by Western blot in 3 to 8-day-old chicken ovaries, normalized to β-actin. (C) Gray analysis indicates that c-KIT had increased significantly from days 4 to 6. T-tests were used to determine statistically significant differences. The values are the mean ± SEM of six experiments. Asterisks indicate significant differences (**P < 0.01, ***P < 0.001).
