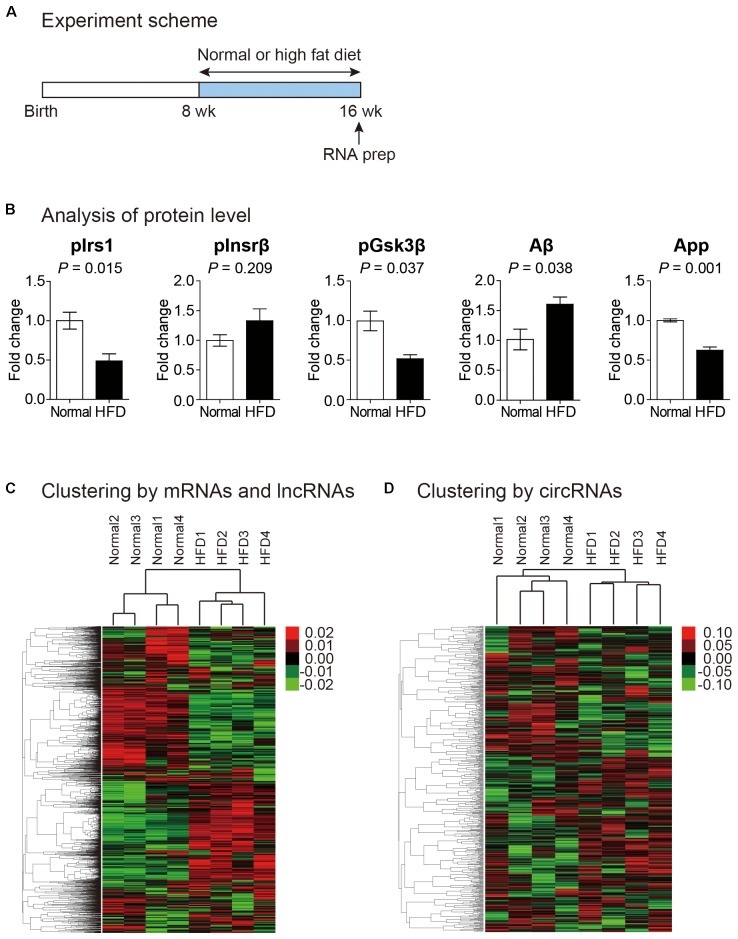
FIGURE 1.
Transcriptomic analysis of the cortex of mouse fed with high fat diet. (A) Experiment scheme to analyze the transcriptome in normal and high fat diet fed mice. (B) Analysis of proteins related to insulin resistance and cognitive impairment. Phosphorylated form of insulin receptor substrate 1 (pIrs1) and that of insulin receptor beta (pInsrβ) were measured to confirm insulin resistance. Phosphorylated form of glycogen synthase kinase 3 beta (pGsk3β), amyloid beta (Aβ), and amyloid precursor protein (App) were measured to indicate cognitive impairment. The data in Supplementary Figure S2 were used for the quantitation. P value was calculated by two-tailed t-test (n = 2 in each group). (C,D) Heat maps of expression profile analyzed from unsupervised hierarchical clustering of mRNAs and lncRNAs (C) and circRNAs (D) were shown. Color bars were included to illustrate relative expression. In both maps, each sample group was clustered properly.

