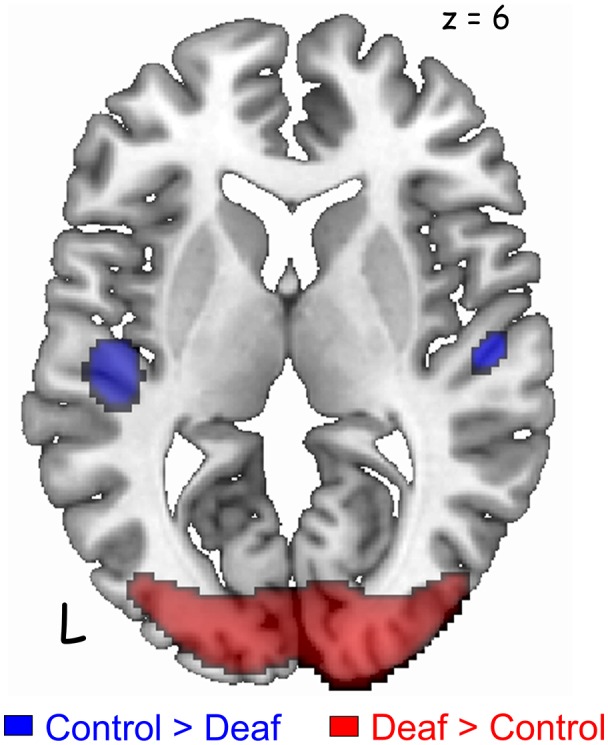
Figure 2.

Significant differences in the auditory and visual cortices between the groups [p < 0.05, family-wise error rate (FWE)-corrected for multiple comparisons]. Deaf patients showed decreased metabolism in the bilateral auditory cortices (blue) and increased metabolism in the visual cortex (red). A cluster in the right auditory cortex survived after small volume correction (SVC) with a corrected p-value of 0.001.
