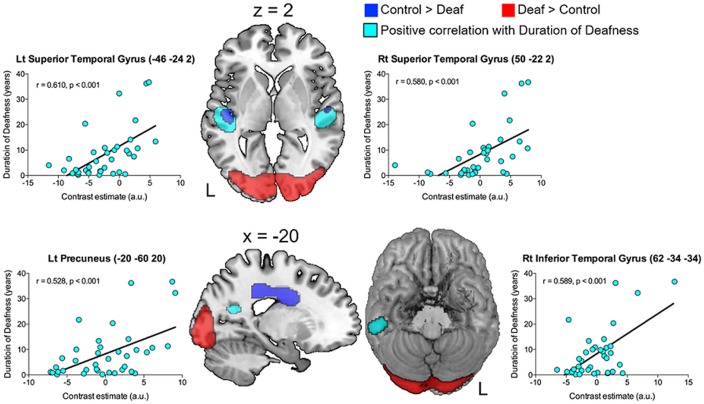
Figure 3.
The brain regions showing significant correlations with clinical factors (p = 0.001, uncorrected). The images are overlaid with the results of the group comparison in Figure 2 (blue: controls > deaf, red: deaf > controls). A gradual increase in metabolism as a function of deafness duration (sky blue) was found in the bilateral superior temporal gyri, the left precuneus, and the right inferior temporal gyrus.

