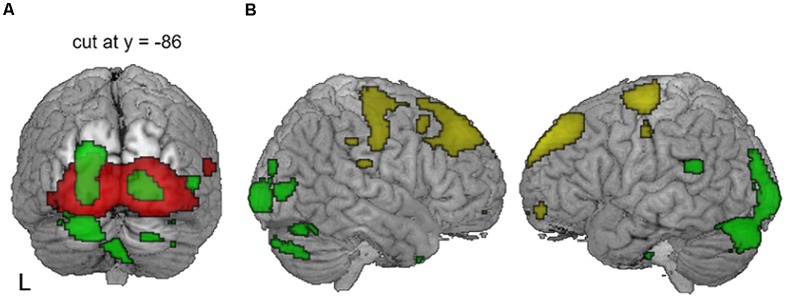
Figure 5.
Patterns of CI outcome-related metabolism with lenient thresholds. (A) With compensatory visual hyperactivity centered in the bilateral calcarine sulci (red), speech-negative correlation (green) centered on the left superior occipital gyrus extended to the right secondary visual area when a lenient statistical threshold was used (uncorrected p = 0.005) but avoided the primary areas along the midline. (B) With an even more lenient threshold of p = 0.01 (uncorrected), dorsoventral dissociation of the metabolic pattern was still apparent. Regions where metabolism was related to good (yellow) vs. poor (green) CI outcomes were located separately in the dorsal frontal vs. the ventral occipitotemporal areas.

