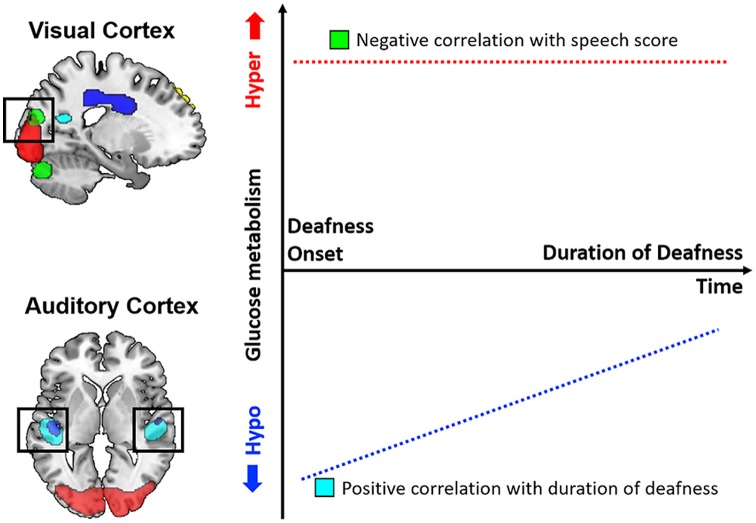
Figure 6.
Schematic diagram of glucose metabolic activity in the visual and auditory cortices and its correlation with speech perception results. In postlingually deafened subjects, metabolic activity was higher in the visual cortex and lower in the auditory cortex compared to the normal-hearing (NH) controls. In addition, the metabolic activities in the auditory areas were significantly correlated with the duration of deafness, but no correlation with speech perception was discovered. In contrast, a negative correlation between the metabolic activities and speech scores was revealed for the visual area.

