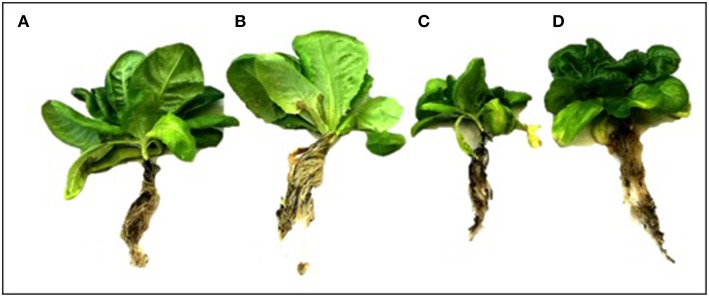
Figure 4.
Morphology of lettuce plants after 90 day in each treatment. Uninoculated (S–) plant without salt stress (A); Plants inoculated with a mix of Antarctic microorganisms (S+) not subjected to salt stress (B); S– plants under salt stress (200 mM NaCl) (C); S+ plant under salt stress (200 mM NaCl) (D). Image credit: H. Hansen.

