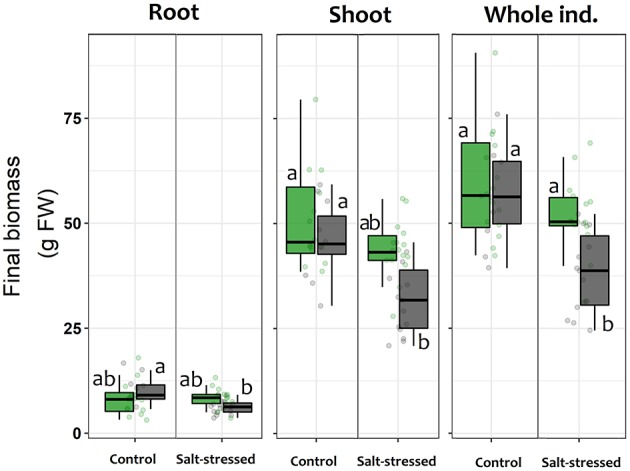
Figure 5.

Final mean fresh biomass weight for roots, shoots and whole individuals of lettuce plants after being subjected for 60 days to saline stress (200 mM NaCl for “stressed” individuals) and inoculated with the Antarctic microbial consortium (S+ plants). Control groups for both conditions (non-stressed and non-inoculated, S–) are also shown. The box-plot represents the interquartile distribution of the data for each experimental group. Different letters indicate significant a posteriori differences (Tukey test, α < 0.05).
