Figure 3.
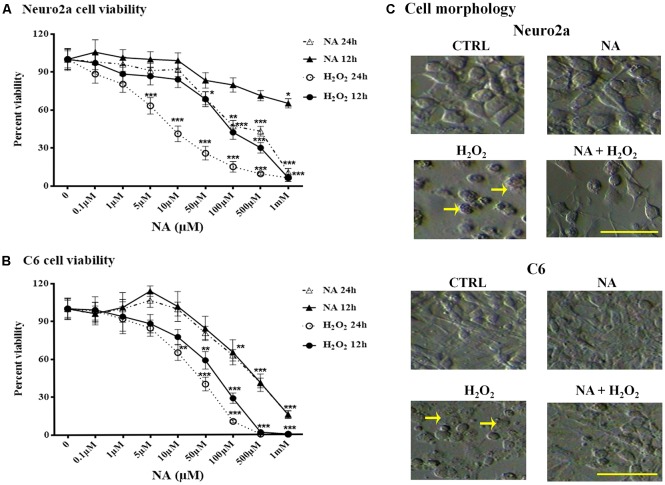
Percentage changes in Neuro2a- and C6-cell viability after 12 h and 24 h treatment with different doses of NA and H2O2 are shown. Viability of both Neuro2a (A) and C6 (B) was least affected (<15% of control) by treatment with up to 10 μM of NA, whereas H2O2 affected the cell viability in even much lesser concentration. *p < 0.05, **p < 0.01, ***p < 0.001 as compared to control. Abbreviations are as in the text. (C) Representative microscopic fields of images of Neuro2a and C6 cells with or without treatment with NA (10 μM), H2O2 or their combination are shown. Both Neuro2a as well as C6 cells showed less adherence to the petri-dish. Those remained adhered, showed membrane granulation and more circular (marked by arrows as representative), which are signs of cellular stress/damage or approaching death upon H2O2 treatment for 24 h. Cells treated with H2O2 in presence of NA showed reduced -detachment, -granulation and -circular shaped in addition to lesser death. Scale bar 100 μm.

