Figure 7.
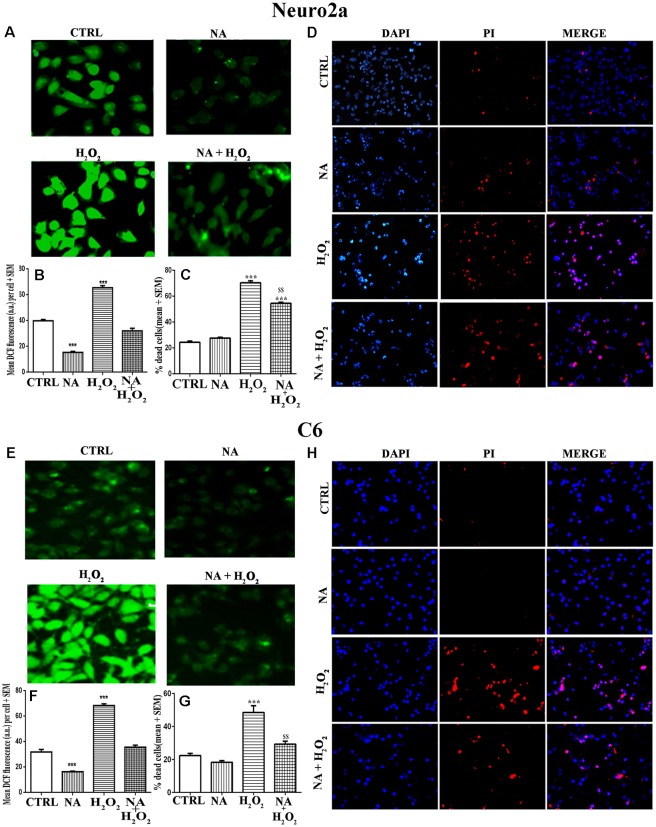
Protective role of NA (10 μM) on H2O2-induced ROS generation and cell death in Neuro2a (upper panels, A–D) and C6 (lower panels, E–H) is shown. Representative photomicrographs of intracellular DCF fluorescence indicative of ROS levels in Neuro2a (A) and C6 (E) are shown. Cells treated with H2O2 alone showed significantly higher fluorescence per cell, while NA treated cells showed significantly reduced fluorescence per cell upon H2O2 treatment. Corresponding histograms of relative fluorescence intensities per cell (mean of 500–600 cells per treatment) from five sets of experiments of Neuro2a (B) and C6 (F) are shown. In separate sets of experiments, the cells were treated for 24 h and percent dead cells were quantified using trypan blue assay. H2O2 significantly increased cell death, which was protected in presence of NA for Neuro2a (C) and C6 (G). Also, using DAPI (stains all live and dead cells) and PI (stains only dead cells) the proportion of dead cells were quantified in coverslip-grown cells treated with NA, H2O2 or both together. Significantly more number of nuclei were PI (red) stained by treatment of H2O2 alone as compared to NA alone and NA+H2O2. Representative photomicrographs (20X) of DAPI and PI stained Neuro2a (D) and C6 (H) are shown. PI stained cell shown in red are dead while DAPI stained all nuclei irrespective of live or dead are shown in blue; PI stained cells are seen more in H2O2 treated groups. All readings were taken in duplicate and three (N = 3) such sets of experiments were conducted. ***p < 0.001 as compared to untreated cells, while $$p < 0.01 as compared to H2O2 treated cells. Abbreviations are as in the text.

