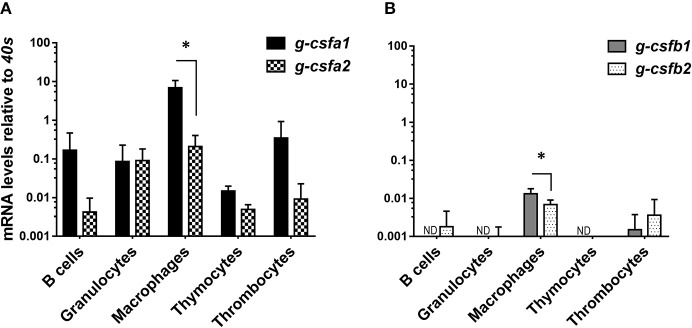
Figure 3.
Quantitative mRNA expression analysis of carp g-csf paralogs in immune cells. Basal gene expression of carp g-csfa1 and g-csfa2 (A) and g-csfb1 and g-csfb2 (B) in sorted cells from healthy carp. Basal expression levels were determined relative to the s11 protein of the 40s subunit (40s) as a reference gene and presented as mean + standard deviation (n = 4 except thymocytes and thrombocytes n = 2). Statistical significance within the macrophage group was determined using an un-paired Student's t-test. Asterisks (*) denotes significance (p < 0.05) between indicated genes. ND indicates “non-detectable”.

