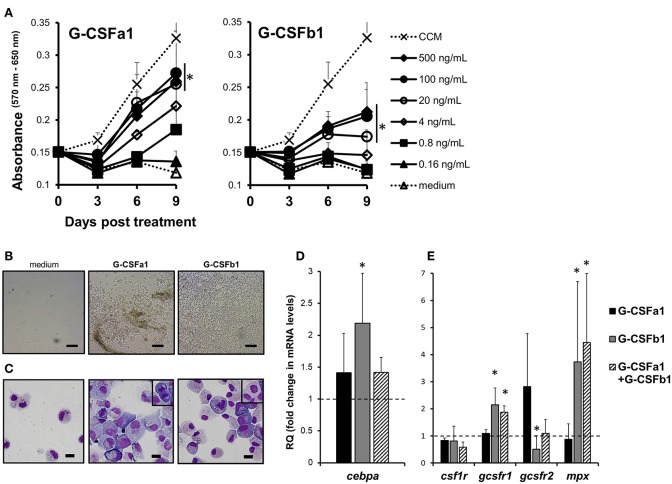
Figure 5.
Proliferation and differentiation of carp kidney neutrophilic granulocyte-like cells. (A) Proliferative response of carp kidney leukocytes (20,000 cells) treated with medium alone, cell conditioned medium (CCM) derived from kidney leukocyte cultures in which macrophages develop, or recombinant carp G-CSF paralogs at different doses. Live cells treated with each stimulus were measured with the MTT assay at day 0, 3, 6, and 9 in the culture. Absorbance values at 650 nm were subtracted from experimental absorbance values at 570 nm in each well. Each point in the graphs represents mean + standard deviation (n = 4). Significant differences compared to medium-treated controls in day 9 were determined using one-way ANOVA followed by Dunnet's post-hoc test, (p < 0.05) are denoted by asterisks (*). (B) Photomicrographs of liquid cultures in the absence (medium only) or presence of recombinant G-CSFa1 and G-CSFb1 after 8 days of culture. Scale bars indicate 100 μm. (C) May-Grunwald Giemsa staining of kidney cells after 8 days culture in the absence or presence of G-CSFa1 and G-CSFb1. Mitotic figures were frequently observed (small enclosure). Scale bars indicate 10 μm. (D) Quantitative gene expression analysis of carp transcription factors involved in granulopoiesis (cebpα) in carp kidney leukocytes treated or untreated with G-CSFa1 (100 ng/mL), G-CSFb1 (100 ng/mL) or a combination of G-CSFa1 (100 ng/mL) and G-CSFb1 (100 ng/mL) for 12 h. The mRNA levels were calculated using β-actin as a reference gene. Data were normalized to the control cells (dashed like at y = 1) and mean + standard deviation is shown (n = 4). Significant differences compared to unstimulated controls were determined using one-way ANOVA followed by Dunnet's post-hoc test, (p < 0.05) are denoted by asterisks (*). (E) Quantitative gene expression analysis of myeloid cytokine receptors and myeloperoxidase in carp kidney leukocytes treated or untreated with G-CSFa1, G-CSFb1 or a combination of G-CSFa1 and G-CSFb1 for 4 days. The mRNA levels were calculated using β-actin as a reference gene. Data were normalized to the control cells (dashed line at y = 1) and mean + standard deviation is shown (n = 4). Significant differences compared to unstimulated controls were determined using one-way ANOVA followed by Dunnet's post-hoc test, (p < 0.05) are denoted by asterisks (*).

