Figure 6.
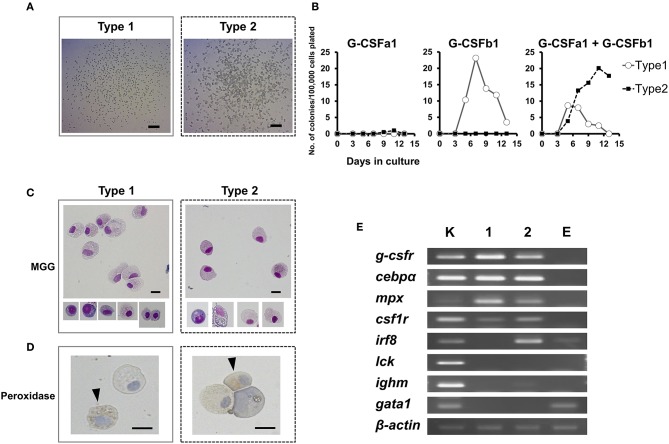
Colony formation of kidney cells in response to recombinant carp G-CSFa1 and G-CSFb1. (A) Colony-formation of kidney cells in response to G-CSF paralogs. Overall two types of colonies (type 1 and type 2) were observed. Bars indicate 200 μm. (B) Colony counts during semi-solid culture of kidney cells (1 × 10⁵) in the presence of 100 ng/mL G-CSFa1 alone, 100 ng/mL G-CSFb1 alone, or a combination of 100 ng/mL G-CSFa1 and 100 ng/mL G-CSFb1. Each point indicates mean colony counts from 4 individual fish under each condition. Cultures scored every 2 days between 3 and 13 days of incubation. (C) May-Grünwald Giemsa (MGG) staining of colony cells (type 1; left and type 2; right). Bars indicate 10 μm. (D) Peroxidase-staining of cells obtained from type 1 colonies (left) and type 2 colonies (right), counterstained with Mayer's Hematoxylin. Arrow heads indicate myeloperoxidase-positive cells. Bars indicate 10 μm. (E) RT-PCR analysis for expression of lineage-associated marker genes in type 1 (lane 1) and type 2 (lane 2) colony cells. cDNA from carp kidney leukocytes was used as a positive control (lane K). cDNA from cells cultured in the presence of 100 ng/mL carp EPO was utilized for the control group of the erythroid lineage (lane E).

