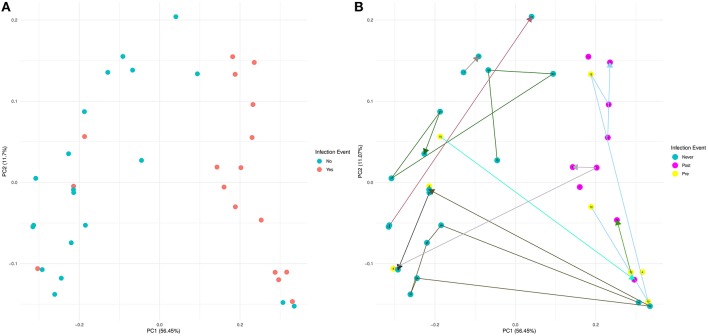
Figure 2.
Weighted UniFrac beta diversity (16S rRNA gene sequencing) is significantly different between samples from NIC and IC patients. A Principal Coordinates of Analysis ordination plot of the weighted UniFrac distances of the samples sequenced by 16S rRNA gene sequencing at a read depth of 1481 (37 of 44 samples). (A) Samples that came from NIC patients are colored blue and samples from IC patients are colored red. (B) Samples colored based on whether a sample came from an NIC patient (never in blue) or an IC patient pre (yellow) or post (purple) their initial infectious complication. Lines connecting samples represent the chronological order of sample collection from each patient. Numbers on points and the color connecting points together are colored by individual (Supplementary Figure 1).

