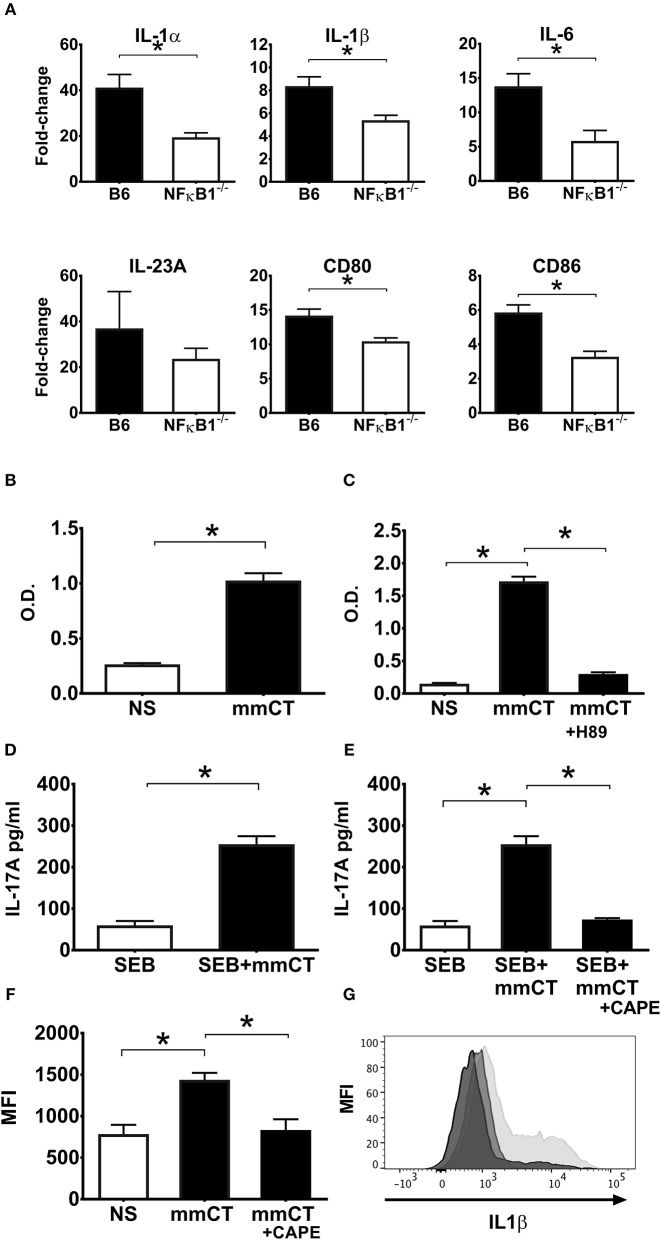
Figure 6.
NFκB signaling is also required for the adjuvant activity of mmCT on mouse (A) and human APCs (B–G). BMDCs from wild-type (B6) or NFκB−/− mice were left untreated or were treated for 16 h with 1 μg/ml mmCT. Purified total RNA was prepared and used for subsequent determination of IL1α, IL1β, IL6, IL23, CD80, and CD86 gene expression by customized RT-PCR array from SABiosciences; bars represent means plus SEMs of fold-change differences in gene expression between mmCT treated and untreated samples (A). Human monocyte cell line (THP1Blue−NFκB) were treated in triplicates with or without 1 μg/ml mmCT (B), or in (C) with the PKA inhibitor H-89 for 1 h prior to treatment with 1 μg/ml mmCT for 16 h. In (D) purified CD14+ monocytes tested in triplicates were left untreated or were treated for 16 h with 1 μg/ml of mmCT or in (E) with the NFκB inhibitor CAPE for 1 h before the 16 h treatment with 1 μg/ml mmCT, whereafter the cells were, washed, and co-cultured for 3 days with autologous CD4+ T cells plus SEB, and secreted IL-17A in culture supernatants determined. Bars represent means plus SEM of IL-17A concentrations in culture supernatants measured by ELISA. In (F) PBMCs were treated in triplicates with or without CAPE for 1 h prior to 16 h treatment with 1 μg/ml mmCT, or medium (NS), and levels of intracellular IL-1β in CD14+ monocytes were then analyzed by flow cytometry. Bars represent means and SEMs of median fluorescence intensity (MFI) for IL-1β. (G) shows representative ICCS histogram overlays of IL-1β expression in gated CD14+ monocytes treated either with mmCT (light gray filled histogram), with mmCT after preceding CAPE treatment (medium gray filled histogram), or with only medium (dark gray filled histogram).*represents p < 0.05 for the indicated comparisons. Data are from one of three separate experiments showing similar results.

