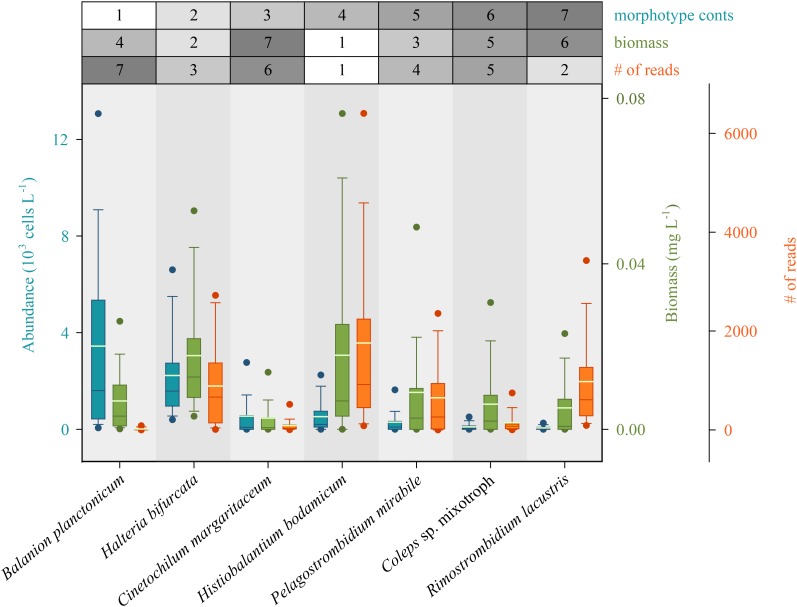
FIGURE 4.
Rank order of the seven most abundant ciliate species based on abundances compared to their biomasses and the number of species specific reads (HTS) during the 3 years of investigation (n = 74 for each species). Method specific rank orders are listed in the table above the panel. Bars show the 25th, 50th, and 75th percentiles, lines in each bar show medians, whiskers stand for the 10th and the 90th percentiles and points indicate the 5th and 95th percentiles. The white lines in bars are averages.

