Figure 1.

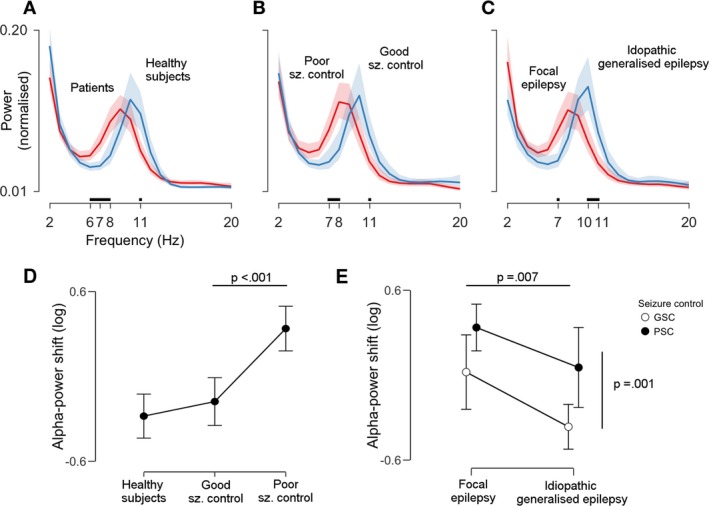
Alpha power is shifted towards lower frequencies in patients with poor seizure control across clinical syndromes. The three plots in the upper row (A–C) compare the following pairs of power spectra (from left to right): patients versus healthy subjects, patients with poor versus good seizure control (GSC), and patients with focal versus idiopathic generalized epilepsy. Lines indicate group averages and shaded areas 95% confidence intervals (CI). Tick marks and black lines above the x‐axis show frequencies at which power spectra diverge: a shift towards lower alpha frequencies can be appreciated for the whole patient cohort, for poor seizure control, and for focal epilepsy subgroups. Plots (D and E) show the statistical assessment of this observations in terms of the (log‐transformed) alpha‐power shift, that is the ratio of average low‐ to average high alpha‐power. Higher values indicate more low‐alpha power. Dots and error bars represent means ± 95% CI. P‐values are derived from pair‐wise contrasts of two analyses of covariance (see Methods for details). There was a significant difference between healthy subjects and patients, which was driven by poor seizure control patients (P < 0.001, panel D). The power spectrum of focal epilepsy patients was more shifted than the power spectrum of idiopathic generalized epilepsy patients (P = 0.007, panel E, horizontal line). However, there was no syndrome‐by‐seizure control interaction: alpha power in poor seizure control patients was always more shifted than alpha power in GSC patients (P = 0.001), and this occurred in equal measure in both syndrome categories (panel E, vertical line).
