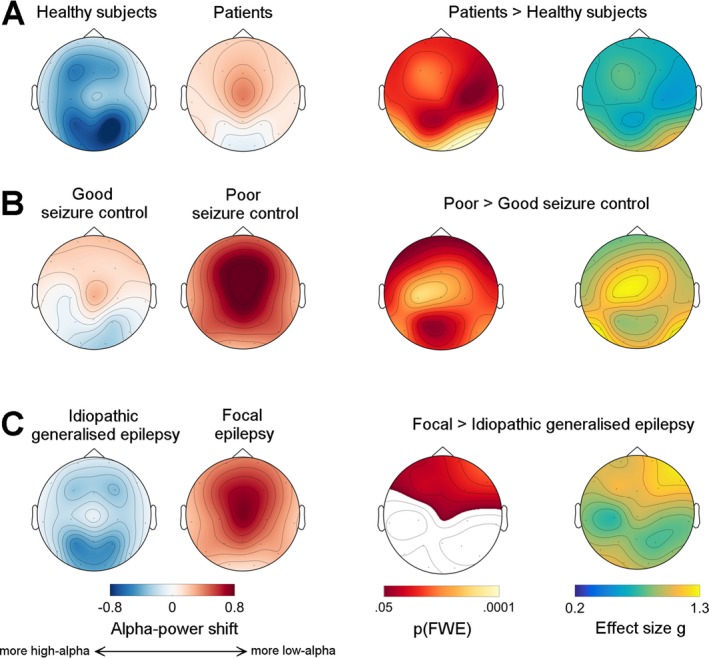
Figure 2.

Alpha‐power shifts are topographically extended, indicating a forward spread of low‐alpha power. This figure shows topographical maps for three pair‐wise comparisons: panel (A), healthy subjects versus all epilepsy patients, panel (B), good‐seizure control versus poor‐seizure control patients, and panel (C), idiopathic generalized epilepsy versus focal epilepsy patients. The first two columns on the left show raw data: positive values (red) indicate a shift of electroencephalogram (EEG) power towards the low‐alpha band, negative (blue) values a shift towards the high‐alpha band. The third and fourth column show statistical maps, that is P‐values and effect sizes, respectively. Maps of family‐wise error (FWE) corrected P‐values were derived using permutation tests. White areas did not reach the significance threshold. The last column shows effect size maps (Hedges’ g), where g = 0.2 represents a weak, and g = 1.3 a very large effect. Note that all patients present significant shifts of alpha power compared to healthy controls over the entire scalp (panel A), with large effects occipitally, and that this effect is particularly pronounced in poor seizure control patients: very large effects are seen here over bilateral and midline frontal regions (panel B). Finally, t focal epilepsy patients had more frontal alpha‐power shift, that is more low‐alpha power, over frontal regions compared to idiopathic generalized epilepsy patients, (panel C).
